GB GB
Weather forecasting (LCD Section 1)
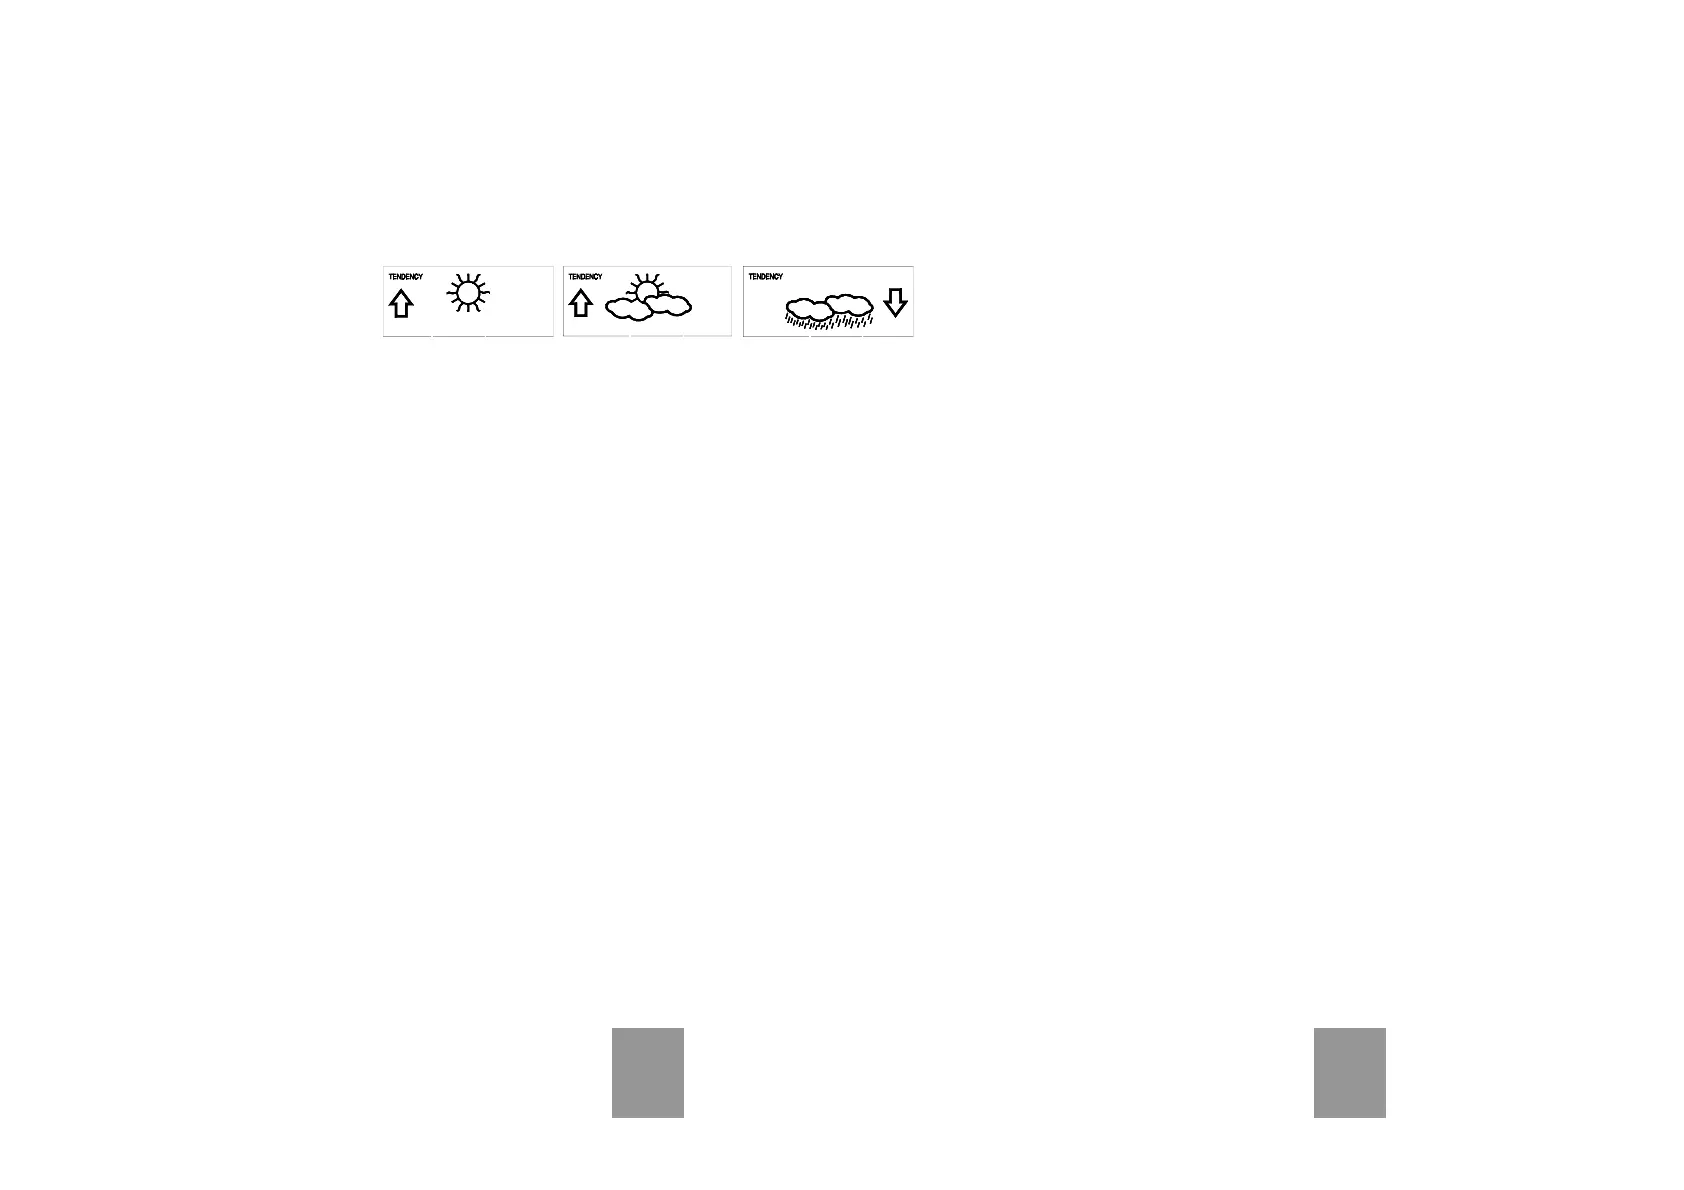
The three weather icons Sunny, Cloudy and Rainy represent the
weather forecasting. There are also two weather tendency indicators
to show the air pressure tendency either side of the weather icons.
Sunny Rainy Cloudy
Notes to hPa sensitivity setting for weather forecasting:
The hPa (Hekto-Pascal) pressure sensitivity can be set to suit the
user’s requirement for weather forecasting from 2 hPa to 4 hPa (see
Basic Programming below). For areas that experience frequent
changes in air pressure (which does not necessarily reflect a change
in the weather) requires a higher hPa setting compared to an area
where the air pressure is stagnant. For example if 3 hPa is selected,
then there must be a fall or rise in air pressure of at least 3 hPa be-
fore the weather station will register this as a change in weather.
Air Pressure (LCD Section 1)
The air pressure reading is displayed here. Press the PRESSURE
key to toggle between relative and absolute air pressure displays.
Notes to Absolute and Relative Air Pressure:
Absolute air pressure provides the display of the true measured air
pressure of the current time and location. This is not programmable
and the absolute air pressure range of the weather station is from 300
hPa to 1099 hPa (standard air pressure at an altitude of 9,100 meters
is around 300 hPa).
Relative air pressure is the one value that is calculated back to sea
level from the local absolute air pressure and can thus be taken as a
reference for weather condition and weather development for the
entire country. It can be programmed to represent your local sur-
roundings. Since the relative air pressure is also the one value given
by various newspapers, TV and radio broadcasting stations in their
daily weather forecasts for their respective locations, users can set
the relative air pressure of the weather station to this value to repre-
sent readings your their area (see Basic Programming Modes be-
low).
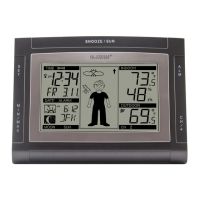
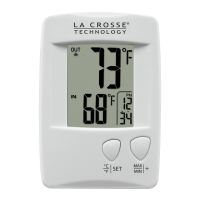
Weather Data (LCD Section 2)
Indoor temperature and humidity are displayed simultaneously in this
section. Use the DISPLAY key to toggle through the displays for other
weather information:
- Outdoor temperature/humidity
- Outdoor wind chill
- Outdoor dew point
- Rainfall 24h
- Rainfall 1h
- Rainfall total.
Notes to Dewpoint and Windchill:
Air can at a certain temperature only carry a certain amount of water
(water vapor), which also increases and decreases with temperature.
If the air temperature decreases below the so called dewpoint (satura-
tion point), the excessive water vapor will condense and fall out in
form of dew, fog or rain. At a temperature of e.g. 15°C and a relative
humidity of 50% the dewpoint will be about 5°C, at 80% humidity
about 12°C. At a relative humidity of 100% saturation is reached, i.e.
the dewpoint is 15°C. At a dewpoint below freezing the fallout will
become frost or snow.
Windchill has been introduced for battle planning during World War II.
It represents not the real measured but the one temperature a person
feels in open area under the influence of wind and cold. Windchill is
laid out in tables for various temperatures and wind speeds. At an
outdoor temperature of e.g. 8°C and calm winds a person moving at a
speed of 6 m/s will already feel a windchill temperature of 0°C.
Wind Data (LCD Section 3)
The current wind direction will be displayed on the LCD compass on
the wind section. Press the WIND key to toggle between wind direc-
tion as numerical (e.g. 225°) and abbreviated characters (e.g. SW) as
well as numerical wind speed display inside the compass circle.
 Loading...