40
18.1
LH=17.2
S1= 19.3S1= 19.3LH=17.2
S1= 19.3S1= 19.3LH=17.2*
LH=17.2
18.2
0.60
0.60
GB
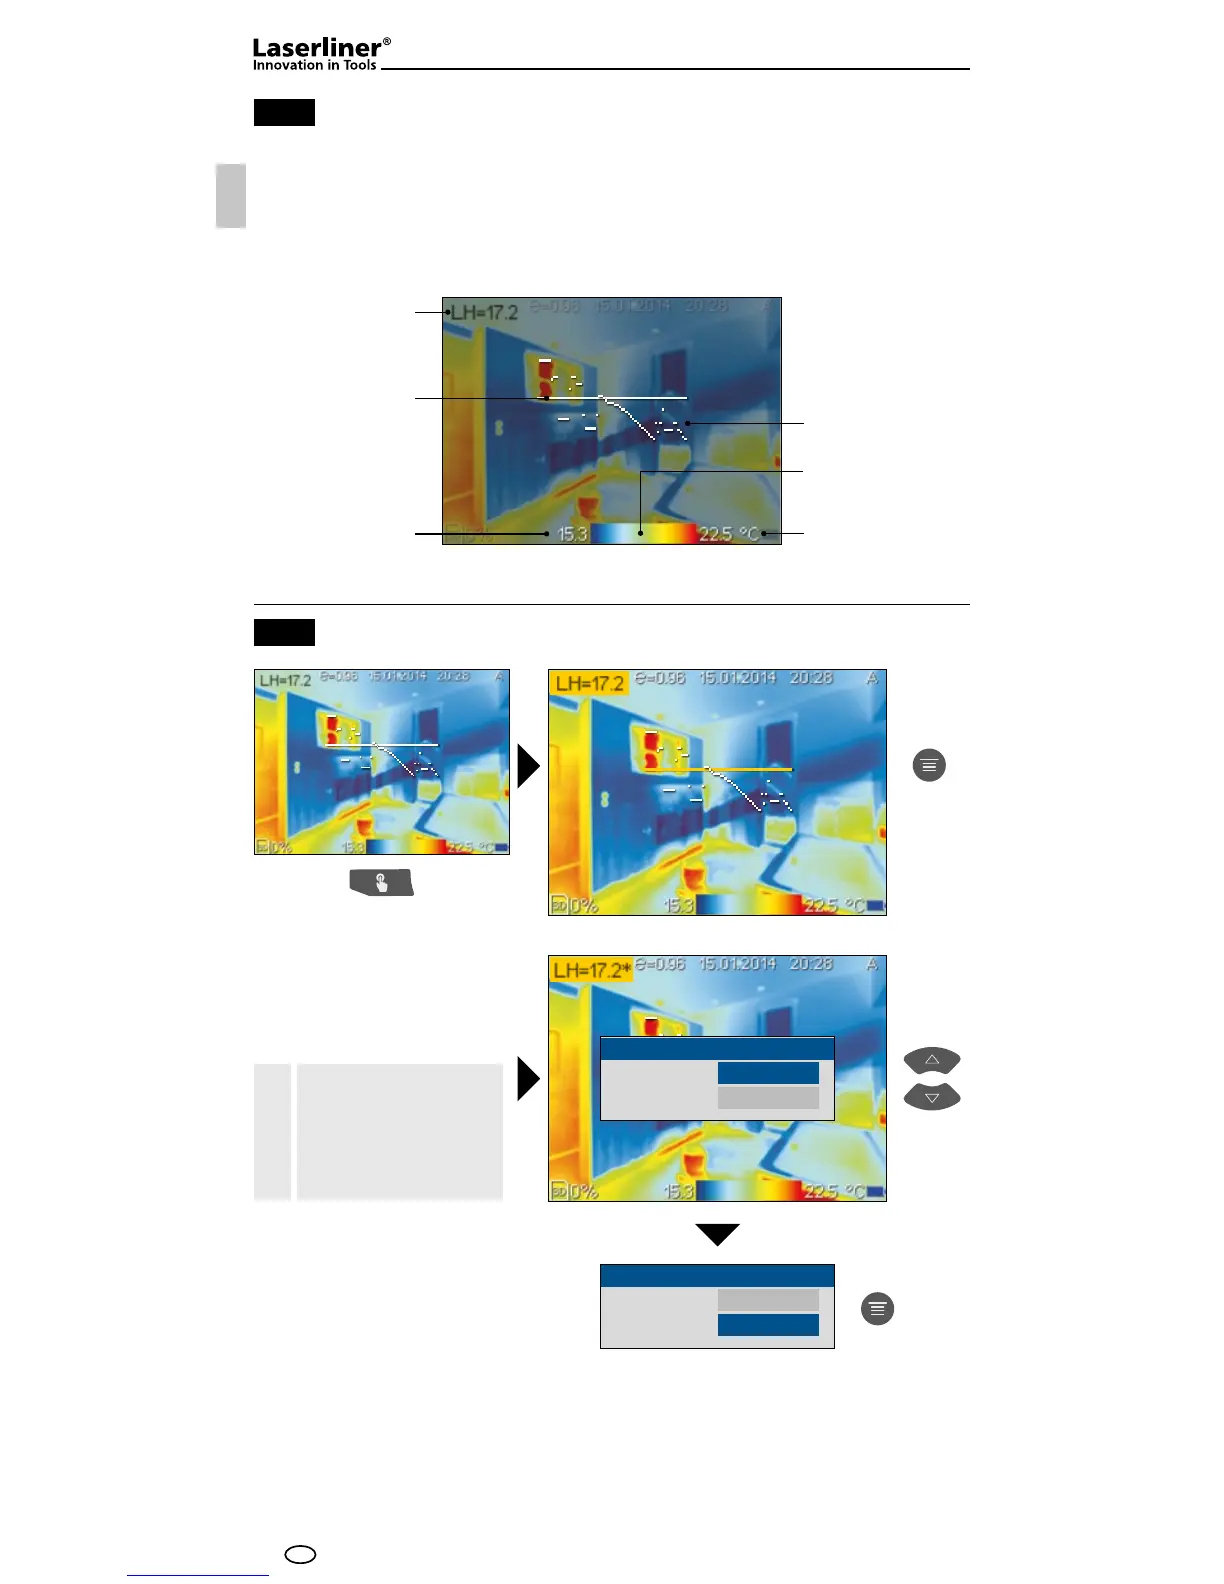
The horizontal line is at 120 (display 240 lines). The bargraph denes the limits of the set
min./max. temperature range (see chapter 21). The dynamic temperature curve visualises
even the smallest changes in temperature within that temperature range, especially if the
colours of the IR image do not provide sufcient differentiation. The temperature curve
only covers the min./max. temperatures shown in the bargraph.
Max. temperature
Temperature curve
Bargraph with
min./max. scale
Min. temperature
Variable horizontal
measurement level
Measurement
point temperature
(centre of
horizontal line)
Horizontal line measurement / arrangement
Horizontal line measurement / parameters
Settings
Emissivity
Delete line Yes
Emissivity
Delete line
Set emissivity for the horizontal
line (LH). Refer to Section 11.1.
The line is deleted.
A * symbol is shown
next to the measured
value if values are de-
fined for measurement
points, lines or areas.
!
Settings
Emissivity
Delete line No
 Loading...