20
LAUNCH
User Manual
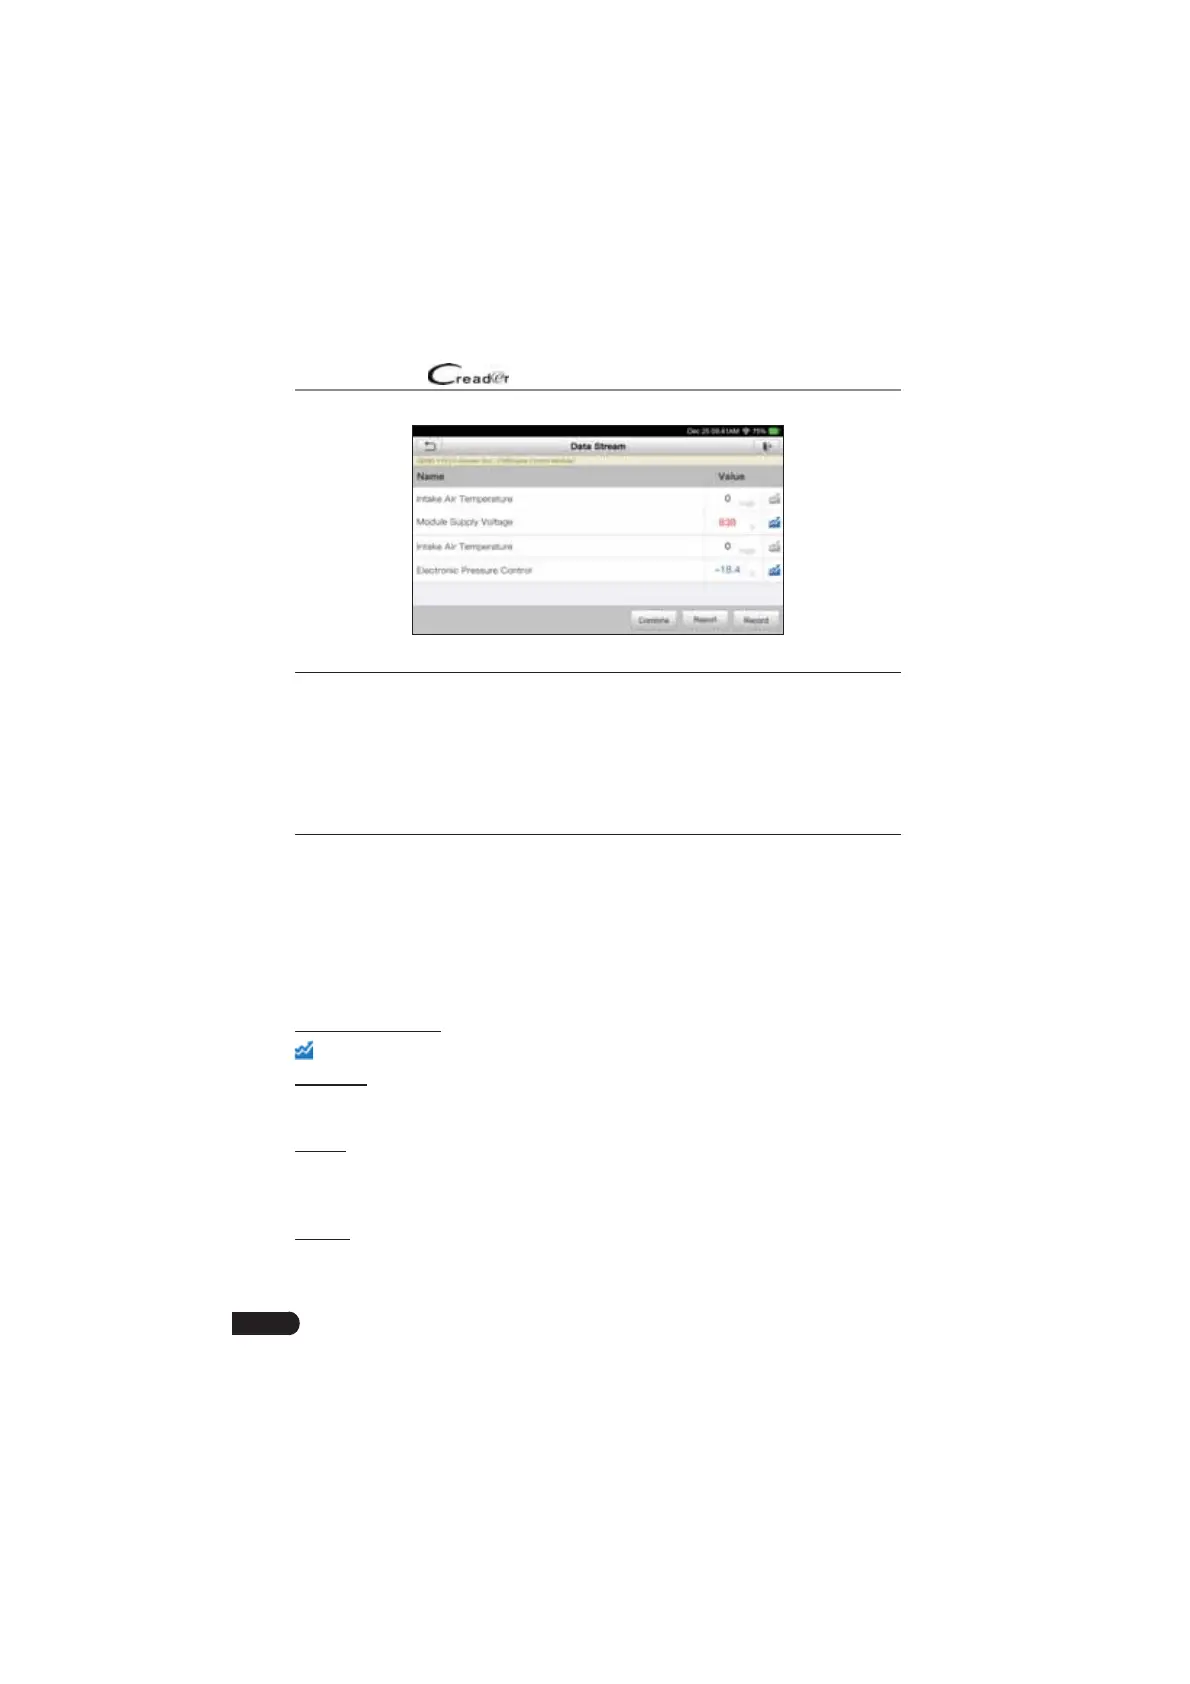
Fig. 5-8
*Notes:
ϭ /f the ǀalue of the Ěata stƌeaŵ iteŵ is out of the ƌanŐe of the stanĚaƌĚ ;ƌefeƌenceͿ
ǀalue the ǁhole line ǁill Ěisplay in ƌeĚ /f it coŵplies ǁith the ƌefeƌence ǀalue it
Ěisplays in ďlue ;noƌŵal ŵoĚeͿ
Ϯ The inĚicatoƌ ϭy shoǁn on the ďoƩoŵ of the scƌeen stanĚs foƌ the cuƌƌent paŐe
total paŐe nuŵď
eƌ ^ǁipe the scƌeen fƌoŵ the ƌiŐhtleŌ to aĚǀanceƌetuƌn to the
nedžtpƌeǀious paŐe
There are 3 types of display modes available for data viewing, allowing you to
view various types of parameters in the most suitable way.
• Value – this is the default mode which displays the parameters in texts and
shows in list format.
• Graph – displays the parameters in waveform graphs.
• Combine – this option is mostly used in graph merge status for data
comparison. In this case, different items are marked in different colors.
On-screen Buttons:
: Tap it to view the waveform graph of the current data stream item.
Combine: Tap it, a pull-down list of the data stream items appears on the
screen. Select the necessary items and the screen will display the waveforms
corresponding to these items immediately.
Report: Tap to save the current data as a diagnostic report. All diagnostic reports
can be accessed from “Data” -> “Diagnostic Report”. The tool logs the Date of
Report (the date and time at which the report was created) and assigns a unique
Report #.
Record: Tap to record and save Live Data. Recorded Live Data can serve as
valuable information to help you in troubleshooting and diagnosing vehicle
problems. The saved ¿le follows the naming rule: It begins with vehicle type, and