Section 2. Configuring the gas analyzer
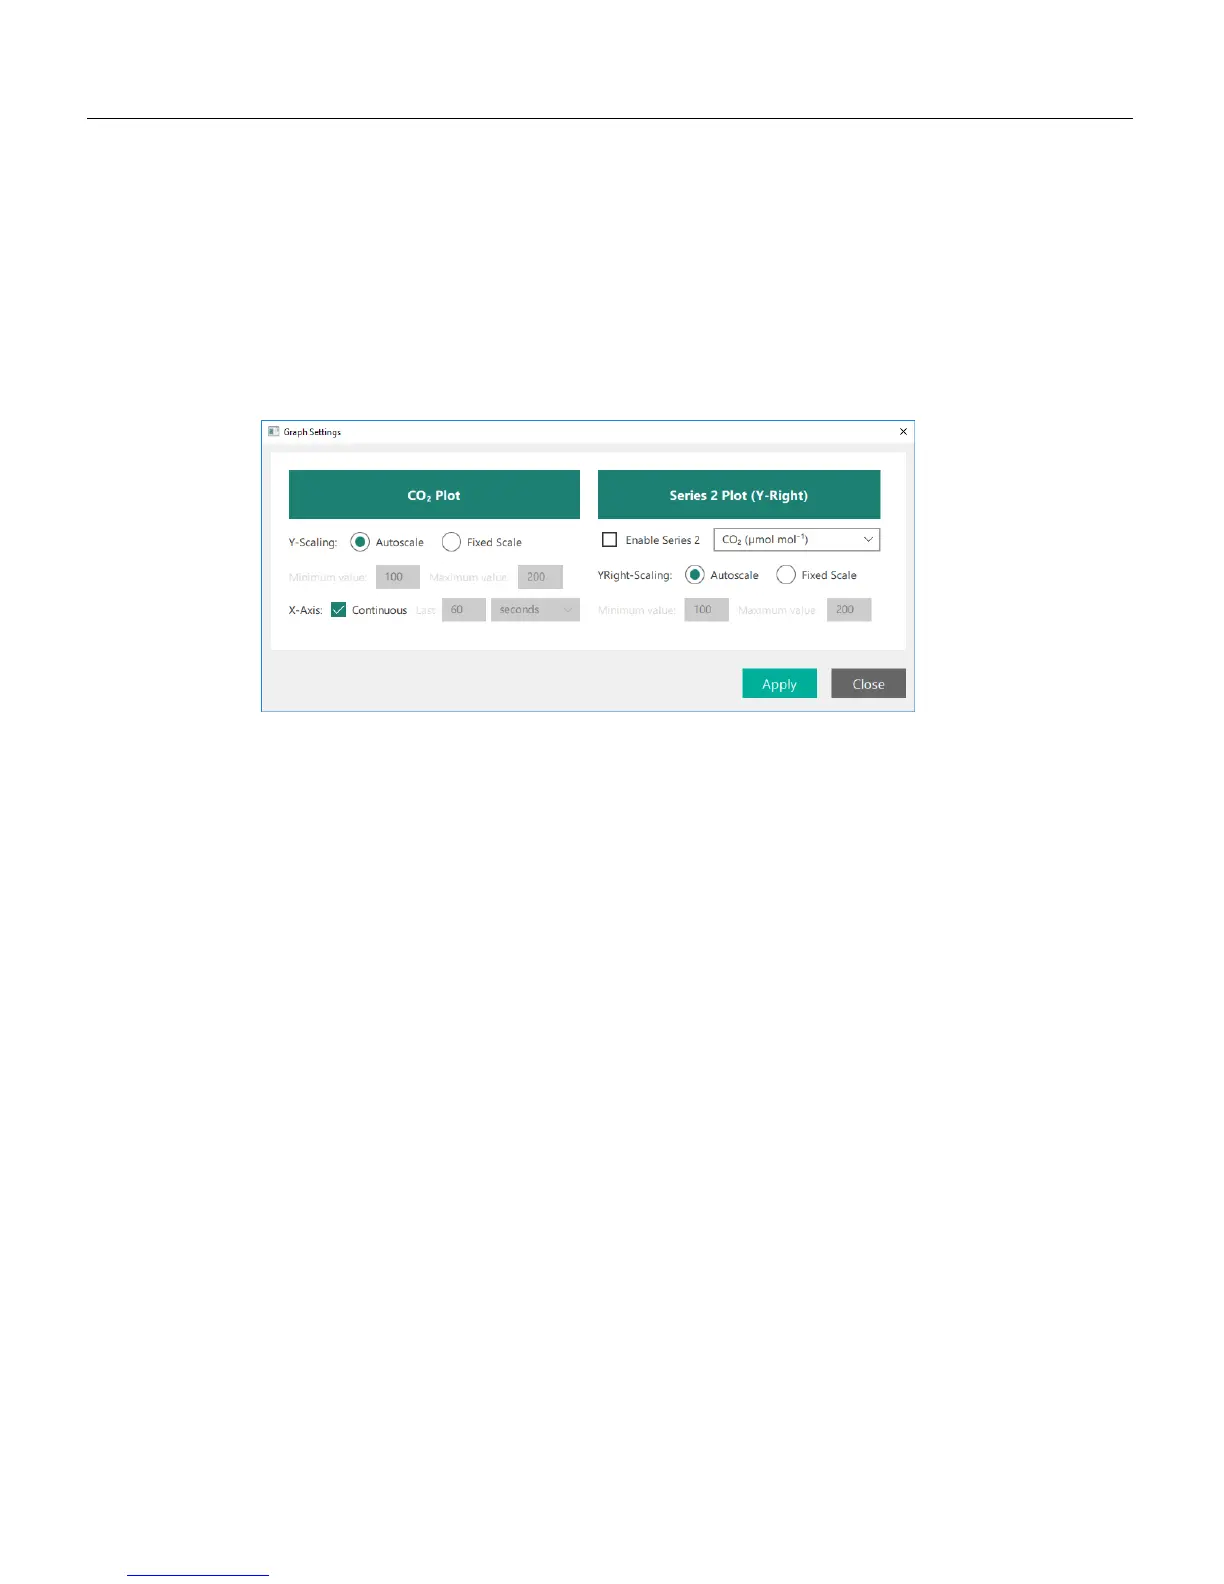
Configuring graphs
The software will always display a graph on the main page (two with the LI-850),
and you can configure the graphs by clicking the Charting button or any of the
Chart Settings buttons beside a particular chart. The options available are the same,
regardless of how you get to them.
The graphs display a fixed variable: CO
2
and H
2
O with the LI-850. You can con-
figure the settings for each graph and add a second variable. The options are:
Y-Scaling: Choose Autoscale or Fixed Scale. With Fixed Scale, you can set the min-
imum and maximum value for each variable displayed.
X-Axis: With Continuous checked, the graph will display all of the data from the
time you connect to the instrument, rescaling the x-axis when needed. With
Continuous cleared, the graph can be configured to display the most recent data for
a time period.
Series 2 is an option to plot a second variable on the graph with scaling on the
right axis. When checked, you can choose from CO
2
concentration, cell tem-
perature, cell pressure, CO
2
absorption, or input voltage. With the LI-850, the H
2
O
concentration, H
2
O dewpoint, and H
2
O absorption will also be available.
2-2 Using the LI-830 and LI-850 Gas Analyzers

 Loading...