Viscosity-temperature diagram (VT diagram)
Explanations of viscosity-temperature diagram
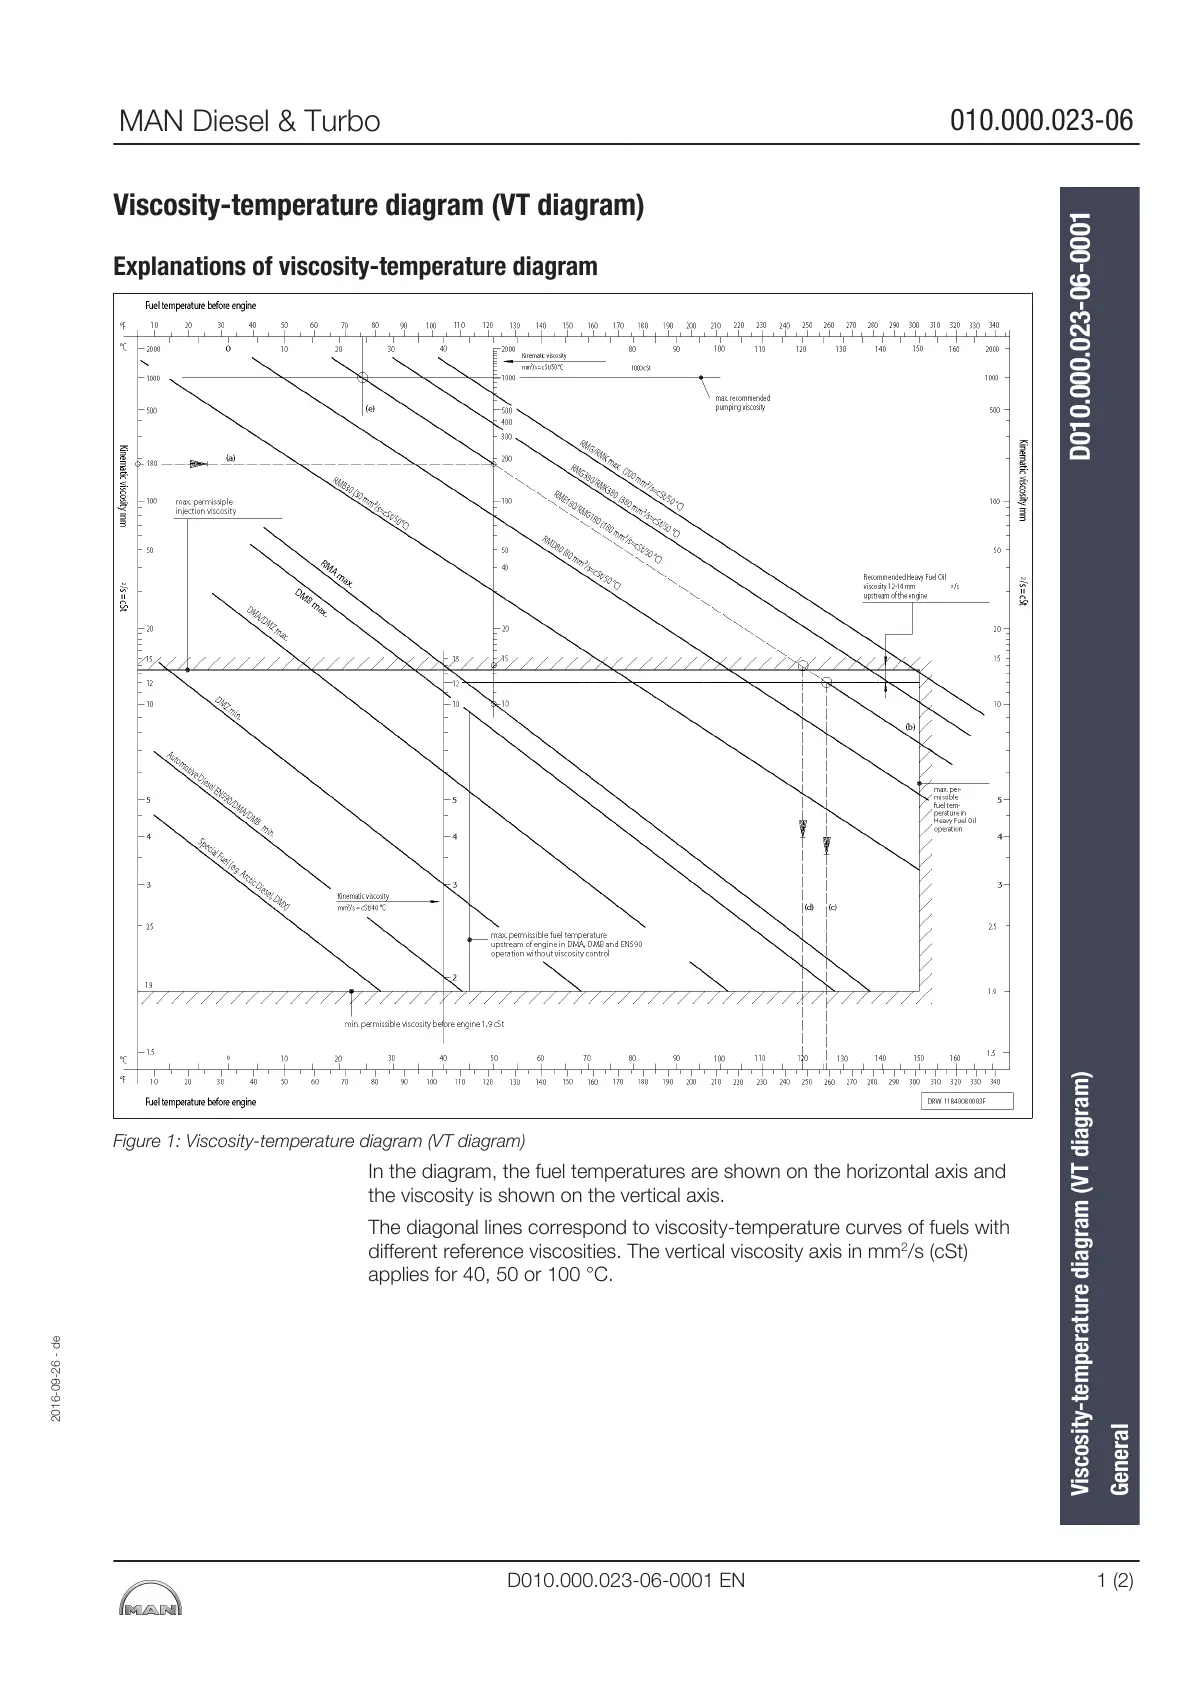
Figure 1: Viscosity-temperature diagram (VT diagram)
In the diagram, the fuel temperatures are shown on the horizontal axis and
the viscosity is shown on the vertical axis.
The diagonal lines correspond to viscosity-temperature curves of fuels with
different reference viscosities. The vertical viscosity axis in mm
2
/s (cSt)
applies for 40, 50 or 100 °C.
2016-09-26 - de
Viscosity-temperature diagram (VT diagram)
D010.000.023-06-0001
General
MAN Diesel & Turbo
010.000.023-06
D010.000.023-06-0001 EN 1 (2)
 Loading...