2 3
Positioning the Screen (Figure 3)
Hang or hold a small mirror on the screen and tilt or turn the
screen until the projected spot of light is properly directed towards
the patient.
Correct Letter Size and Focus
1. Project the 20/200 N on the screen.
2. As a reference for proper measurements, have someone hold the
distance scale (Figure 4) on the screen and focus the 20/200 N to
measure evenly with the respective distance line. (The scale of 10
to 20 feet refers to the distance from patient to screen.)
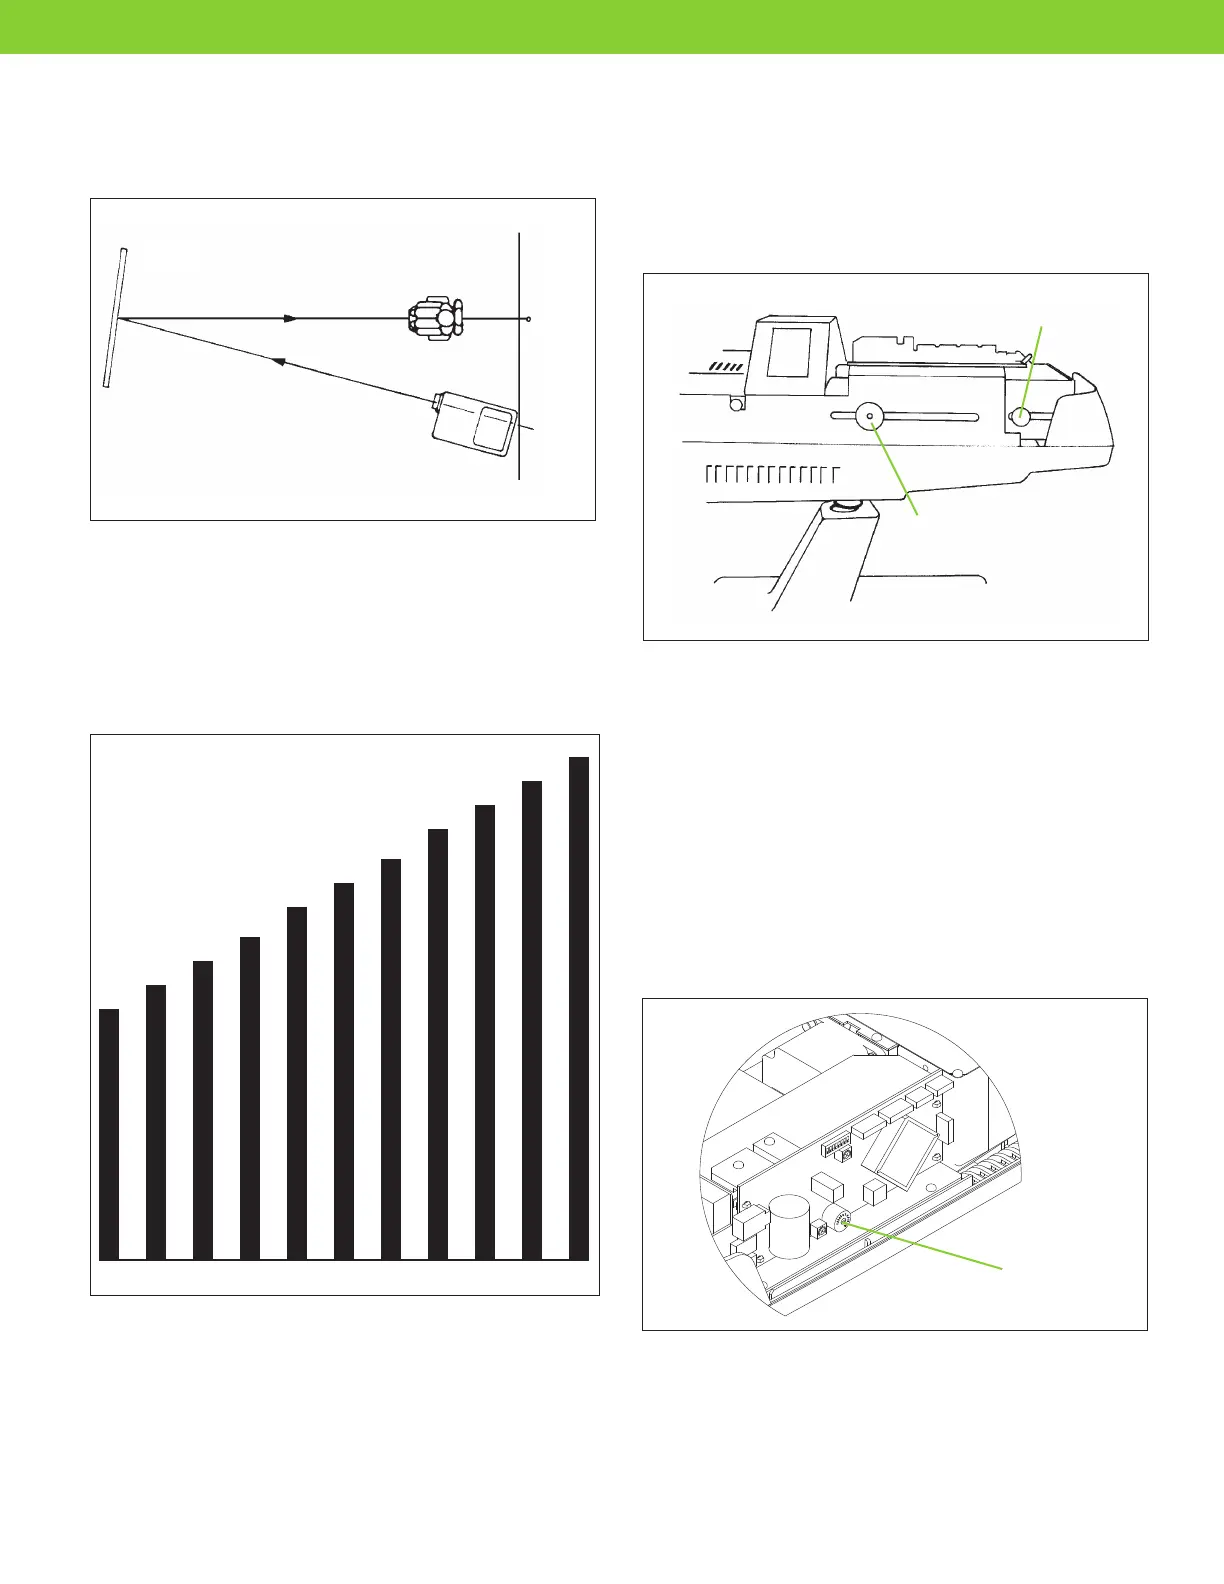
3. To adjust for proper letter size and focus, remove the top cover
by turning the top cover screw 1/2 turn counterclockwise (refer to
figure 5). For image focusing, loosen the focusing knob and slide
the focusing tube forward or backward to obtain proper focus. The
rear adjustment knob controls letter size. Loosen and slide the
knob forward or backward for proper letter size. When adjustments
a
re completed, tighten both knobs and replace the top cover.
Chart Brightness Adjustment
The brightness level of the projected image can be adjusted in five
selectable steps.
1. To adjust the chart brightness level, first remove the top cover
by turning the top cover screw counterclockwise 1/2 turn.
2. Turn the small round rheostat switch located on the side circuit
board clockwise with a small straight slot screwdriver (please see
Figure 6).
3. The brightness level of the projected image can be selected from
1-5 pre-selected steps. Select the level of brightness that best meets
the end-users requirements and re-attach the top cover and secure
with the top cover screw.
Focusing Knob
L
etter Size Control Knob
Figure 5
1100'' 1111'' 1122'' 1133'' 1144'' 1155'' 1166'' 1177'' 1188'' 1199'' 2200''
Figure 4
Screen
P
atient
Spot of
light
on wall
Projector
Figure 3
1
2
3
4
5
6
7
8
1 2 3 4 5 6 7 8
O
N
ON
Round Switch
Figure 6
OPERATION
Using the Remote
To effectively operate the CP-690E, it will be important that you
understand and familiarize yourself with each function of the remote
control unit. It can be easily operated by aiming it directly at the screen
or by aiming it at the Chart Projector. Please take plenty of time to
accustom yourself to the various selections on the remote control.
The diagram in Figure 7 and the descriptions listed below explain each
of the available selections.
“Lamp” On/Off Button
The “Lamp” button controls On/Off of the projection lamp from the
remote control. When initially depressed, the 20/400E will automatically
b
e displayed. If the instrument is not operated for more than 15 minutes, a
series of warning “beeps” will sound and the instrument will automatically
shut off in seven seconds. If a particular chart is needed for more than 15
minutes, depress that chart button again after you hear the warning beeps.
The shut-off timer can be adjusted for a five minute period. Please refer to
Figure 9, Setting the Remote Control Code. When switch #6 is turned on,
the timer is set for 15 minutes; when #6 is off, the timer is set for five minutes.
Snellen Letter Charts
Eight snellen charts provide selections from 20/400 to 20/10 with
five 20/20 lines. Vertical isolations of the 20/20 chart will also display
additional 20/20 lines.
Illiterate E Charts
Four illiterate E charts provide selections from 20/100 to 20/15.
Number Charts
Five number charts provide selections from 20/200 to 20/10.
Children’s Charts
Three child charts provide selections from 20/100 to 20/20.
Vectograph/Polarized Charts
The CP-690E is supplied with a variety of vectograph or “specialty” charts
including a unique Minute Stereo test chart. When a polarized lens is
presented to the patient after subjective refinement is completed, the
Minute Stereo test chart is viewed by the patient in a 3-dimensional
pattern with each symbol “floating” in space beginning with the triangle
and following in a clockwise pattern to the circle, star, and then square. A
correct response by the patient accurately verifies subjective refinement.
Single Character Masking Button
Depressing the single character masking button will totally isolate any
single character on any acuity chart. To move the isolation from side to side,
depress the vertical masking buttons. To move the isolation up or down to
another line on the same chart, depress the horizontal masking buttons.
Movable Vertical/Horizontal Masking Buttons
Depressing the left vertical masking button will vertically isolate
the far left line on any acuity chart. The right vertical masking
button will vertically isolate the far right line on any chart. Repeated
depressions of these buttons will move the isolation from side to side.
Depressing either horizontal masking button will allow you to move
the vertical isolation up or down the selected acuity range.
Depressing the top horizontal masking button will horizontally
isolate the top line of any acuity chart. The bottom horizontal
masking button will horizontally isolate the bottom line of any
acuity chart. Repeated depressions of either button will allow you
to move up or down the selected acuity range.
Red/Green Filter Masking Button
In addition to the separate red/green chart provided with the vectograph
charts, the CP-690E also gives you the capability of filtering red/green over
any appropriate chart with the exception of the 20/400 and 20/300 charts.
Filtering is also possible with all illiterate E charts, and all child charts.
Figure 7
V
ectograph/
P
olarized
C
harts
Program
Functions
Red/Green Filter
Movable Masking
Options (vertical,
horizontal)
Snellen Letter
Charts
Number
Charts
I
lliterate E
Charts
C
hildren’s
C
harts
Horizontal
Character Masking
Single Character
Masking
L
amp On/Off
ETDRS Charts
ETDRS is the Early Treatment Diabetic Retinopathy Study
that was designed to help patients with diabetes that developed
Retinopathy. During this clinical study, the ETDRS visual acuity
chart and the LogMar system of visual assessment was determined
to be the best method for assessing more accurate visual acuities.
On the ETDRS acuity chart, the spacing between each letter and
each line is directly related to the width and height of the letters,
respectively. Each line of letters is a scaled-down version of the line
above, meaning the “degree of difficulty” or task for the patient
remains the same as the patient reads down the chart. Also, the
progression of letter sizes is uniform, increasing in a constant ratio
from the bottom to the top of the chart. The results of this visual
assessment are usually recorded in terms of a LogMar “score”.
Program Functions
The program buttons allow you to pre-program three separate
examination sequences. All charts are capable of program storage
as well as a “masked” chart selection.
ETDRS CHARTS
ETDRS Chart
Detail Sticker
 Loading...