Section 5- Nucleic Acids
260/280: ratio of sample absorbance at 260 and 280 nm. The ratio of absorbance at 260 and 280 nm is used to assess
the purity of DNA and RNA. A ratio of ~1.8 is generally accepted as “pure” for DNA; a ratio of ~2.0 is generally accepted
as “pure” for RNA. If the ratio is appreciably lower in either case, it may indicate the presence of protein, phenol or other
contaminants that absorb strongly at or near 280 nm. See “260/280 Ratio” section of the Troubleshooting section for more
details on factors that can affect this ratio.
260/230: ratio of sample absorbance at 260 and 230 nm. This is a secondary measure of nucleic acid purity. The
260/230 values for “pure” nucleic acid are often higher than the respective 260/280 values. They are commonly in the
range of 1.8-2.2. If the ratio is appreciably lower, this may indicate the presence of co-purified contaminants.
ng/ul: sample concentration in ng/ul based on absorbance at 260 nm and the selected analysis constant. See the
“Concentration Calculation (Beer’s Law)” in the appendix for more details on this calculation.
Spectrum Normalization
The baseline is automatically set to the absorbance value of the sample at 340 nm, which should be very nearly zero
absorbance. All spectra are referenced off of this zero.
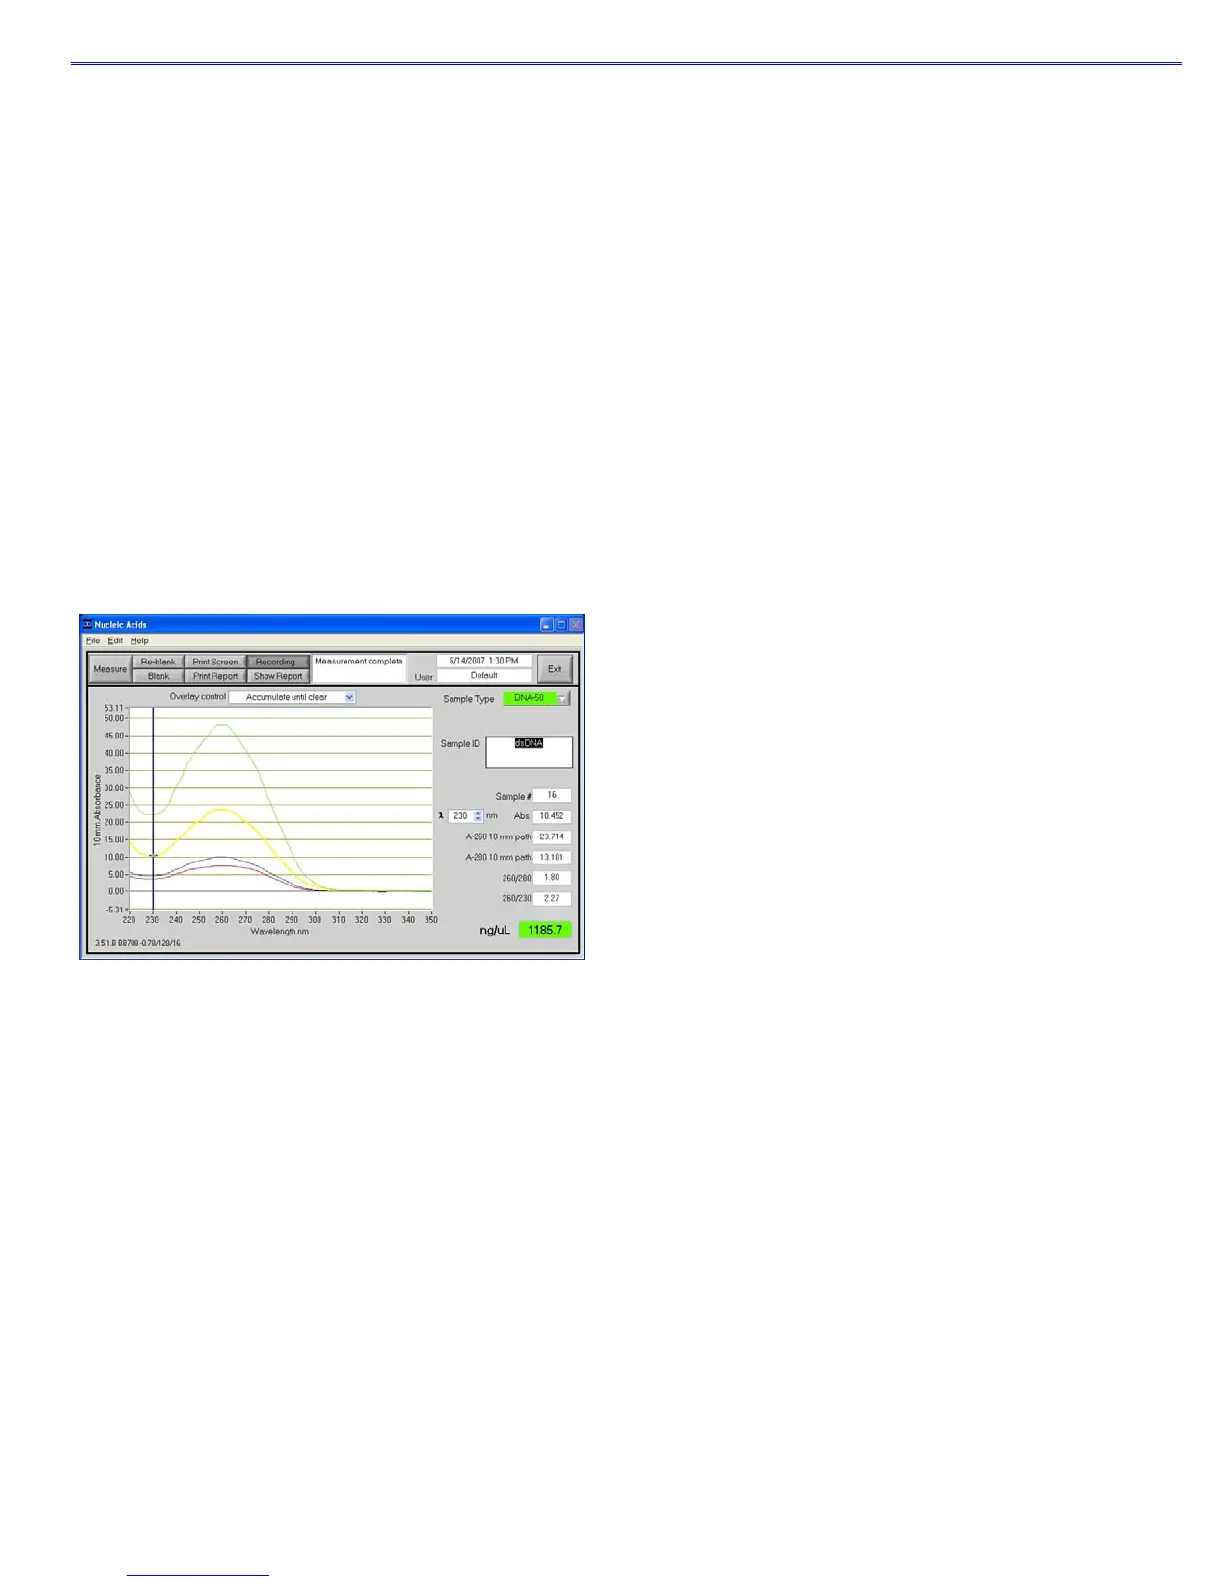
Spectrum Overlay Control
The user can display more than one spectrum in the same display using this feature. The current sample plot will be
displayed in bold and previous plots will be distinguished by different colors as seen in the following example:
The default option is set to clear the display for the next reading. The user may set the overlay control to clear after each
sample plot, (default setting), after each new report, or accumulate plots until prompted to clear. The ‘Clear Now’ setting
will clear all current and previous plots. When the overlay function is active, the software will auto scale the y-axis based
on the sample with the highest absorbance at 260 nm. Note: When the overlay function is active, the ‘Blank’ function does
not clear the existing overlaid sample spectra.
5-2
 Loading...