ADAMII™ © 2016 NanoEntek, Inc.
39
Operation
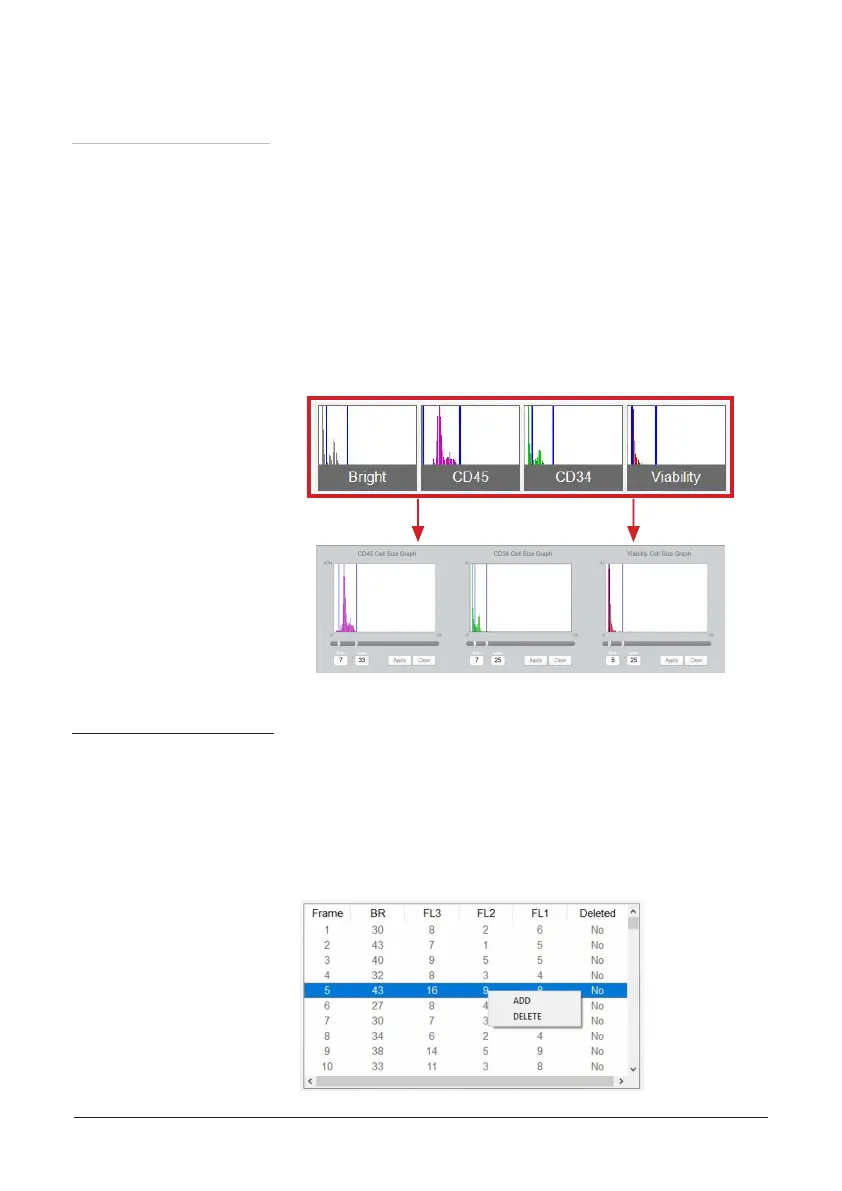
⑦ Raw data table
Data menu
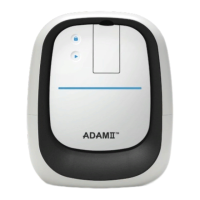
⑥ Histogram
The number of event for each frame will be displayed by channels.
Frame by frame revision of raw data image and removal of inva-
lid frames can be done on the table. For deleting a invalid frame,
click on the right mouse button and select ‘Delete’ menu. Then,
the “Result area” will show the re-calculated data, reflecting the
deleted frame(s).
User can check the cell size graph of each channel. Cell size gating
is available by managing the gating bar in the four different channels.
1. Click the histogram of each channel, then the cell size graph will
be shown. X-axis indicates cell size and Y-axis indicates number
of cells.
2. Press ‘Apply’ button.
3. The blue vertical lines indicate the gating condition.
 Loading...