40
Proler
User Manual
4.3 Chromaticity and gamut/Spectral distribution
In the menu „Window -> Chromaticity and gamut“ or with the shortcut
�2 you open an additional window that shows the actual measurement
in an x-y diagram.
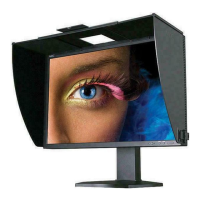
On the left you see the measured X,- Y- and Z- values as well as L*, a*
and b*. On the right you see the corresponding RGB- values.
Once measured, the primaries Red, Green and Blue define a color
triangle, the gamut of your monitor, in the x-y diagram.
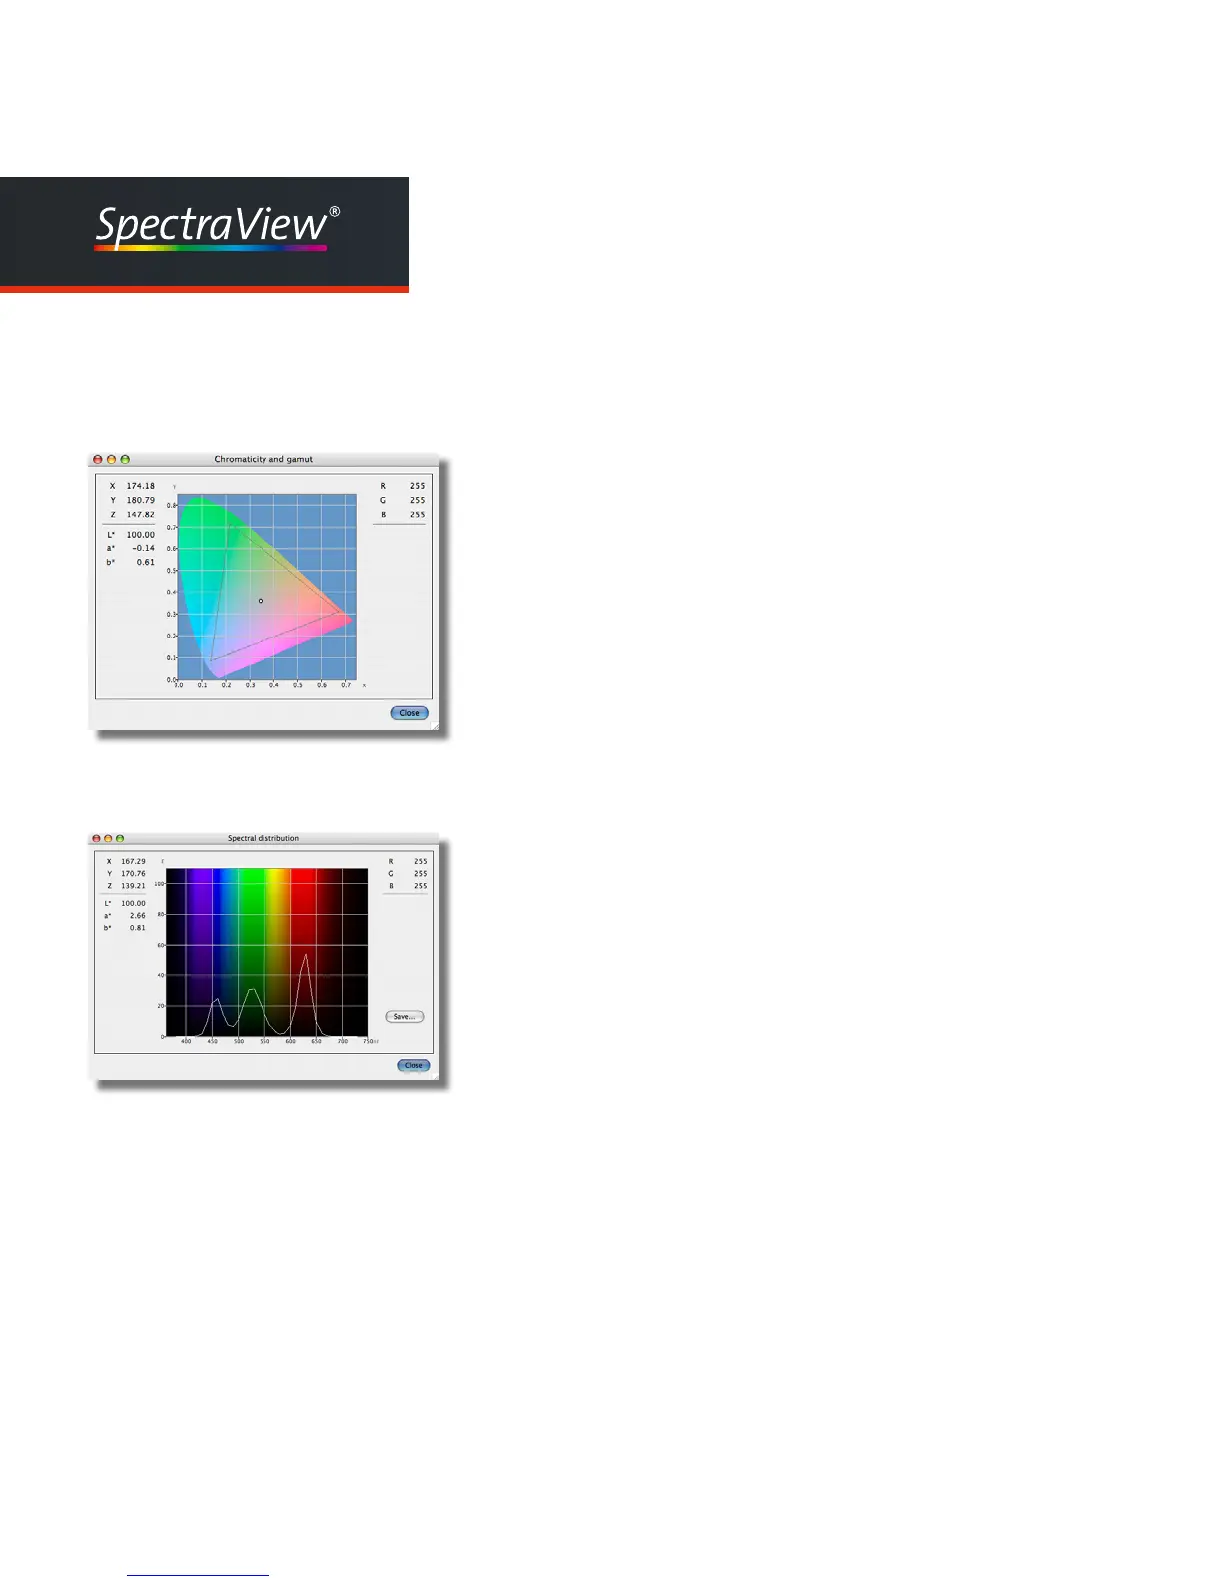
In the menu „Window -> Spectral distribution“ or with the shortcut �1
you open an additional window that shows the spectrum of the actual
measurement. This option is only available if the measurement instru-
ment used is a spectrophotometer. Presently the only spectropho-
tometers avail- able are Gretag Macbeth Eye-One Pro and Eye-One
Monitor.
Click on the <Save> button to store the spectrum in an ISO- 12642
compliant text file.
XY-graph of a measurement value in the
Chromaticity and Gamut window
Spectral distribution for the same measurement