3
GB
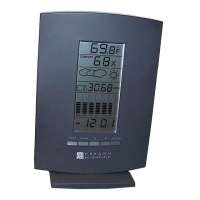
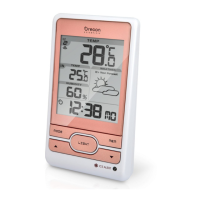
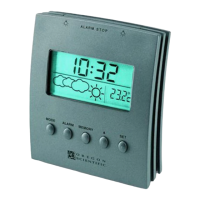
DISPLAY AND FUNCTIONS
COMFORT INDICATOR
PAST PRESSURE
HISTORY IN ' HOUR '
PRESSURE READING
PRESSURE
TREND CHART
INDOOR
TEMPERATURE
WEATHER
FORECAST
RELATIVE HUMIDITY
HOW TO READ THE ILLUSTRATED
WEATHER FORECAST SYMBOLS
Your digital Barometer detects barometric pressure changes
and the LCD displays the illustrated weather symbols which
indicating the weather forecast for 12 to 24 hours ahead, for
an area with a radius of about 30-50 km.
Important:
1. The accuracy of weather forecasting when using
pressure trend alone is about 70 to 75 percent and,
therefore, we cannot be held responsible for any
inconveniences caused by an inaccurate weather
forecast.
2. The weather forecast symbols may not reflect the
current weather condition. The symbols are
forecasting the future.
3. A ‘ Sunny ‘ forecast covering the night-time reflects
fine clear weather.
HOW TO READ THE BAR GRAPH
PRESSURE TREND
Stored memory of the barometric pressure changes are
displayed on the chart, in 5 steps indicating the pressure
1,3,6,12 and 24 hours ago. This chart is plotted by comparing
the past barometric pressure to the present pressure. The
scale on the right shows the comparison result. The ‘ 0 ‘ in the
middle of the scale means equal to present pressure, ‘ +2 ‘
Indicator
displays on
the unit
Forecast
Sunny
Slightly Cloudy
Cloudy
Rainy
 Loading...