8
GB
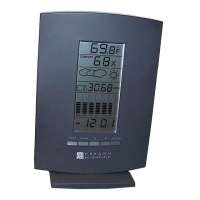
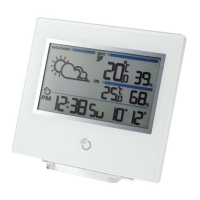
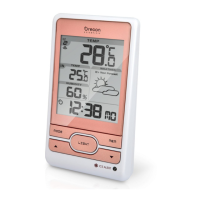
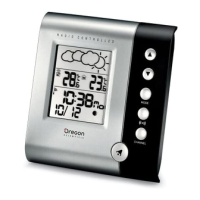
ATMOSPHERIC PRESSURE
The atmospheric pressure indicator in the weather forecast window
uses arrows to indicate if the atmospheric pressure is increasing,
remaining stable, or decreasing.
Forecast Sunny
Partly Cloudy
Cloudy Snowy
Indicator
displays on
the unit
Raining
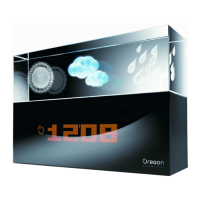
WEATHER FORECAST
The unit is capable of detecting atmospheric pressure changes.
Based on collected data, it can predict the weather for the forthcoming
12 to 24 hours. The effective range covers an area of 30 to 50 km.
NOTE:
1. The accuracy of a general pressure-based weather forecast is
about 70% to 75%.
2. The weather forecasts from this unit are predictions that cover
the next 12 to 24 hours. It may not necessarily reflect the current
situation.
3. The “Sunny” icon, as applies to night time, implies clear weather.
COMFORT LEVEL INDICATORS
The comfort level indicators COMFORT, WET or DRY will tell you
if the curent environment is comfortable, too wet or too dry.
The comfort indicator will appear on the display when the following
conditions are satisfied:
Rising
Arrow indicator
Humidity Trend
Steady Falling
TEMPERATURE & HUMIDITY TREND
The temperature and humidity trend indicator shows the trend of
temperatures and humidities collected at that particular sensor.
Three trends: rising, steady, and falling will be shown.
Rising
Arrow indicator
Pressure Trend
Steady Falling
Rising
Arrow indicator
Temperature
Trend
Steady Falling
913hg-e.p65 04/30/2002, 5:59 PM8
 Loading...