GENERAL FAN FACTS
31
Sound data explanation
SOUND DATA IN THIS
BROCHURE IS BASED ON FOL-
LOWING DEFINITIONS:
The points for which the sound data is present-
ed are along the system line defined by the
pressure and flow stated in the sound data table
for each fan. There are three types of sound in
these tables; inlet- and outlet sound are mea-
sured in duct, while the surrounding sound is
measured outside the fan and duct system. For
all these types of sound, the sound power levels
are presented in octave bands. For the sur-
rounding sound, also the sound pressure level
has been calculated.
THE SOUND POWER LEVEL
The sound power level, Lw(A) is used to calcu-
late the sound from the whole ventilation sys-
tem. This system can be a composition of gril-
les, dampers and diffusers for example.
The sound power level is a measured value
according to standards, and it does not tell how
the sound appears as the sound power is inde-
pendent of the characteristics of the placement
of the fan. In order to resemble the human ear,
the A-filter is used indicated with Lw(A) mea-
sured in dB(A).
THE SOUND PRESSURE LEVEL
The sound pressure level, Lp or Lp(A), tells
how the human ear registrates the sound. It is
dependent on the sound power level, distance
from the source, restrictions of the propagation
and the accoustic characteristics of the room.
The sound pressure level is presented for a
room with an equivalent absorption area of
20 m
2
. 7 dB difference correspond to a distance
of ca 3 m, where the sound is emitted in a semi
spherical propagation.
The sound pressure level can be calculated as:
Lp=Lw + 10Log (Q/4πr
2
+ 4/A)
A= is the room’s equivalent absorption area
Q= is the propagation type:
Q=1 is spherical propagation
Q=2 is semi spherical propagation
Q=4 is quarter spherical propagation.
For the free field case, i.e. from a roof fan, the
sound pressure level is calculated as:
Lp=Lw + 10log Q/4πr
2
.
With Lw(A) tot at 63dB(A), a distance of 5
meters, semi spherical propagation and free
field case, the result will be:
Lp(A)= 63 +10log 2/4π5² = 63-22= 41 dB(A)
And at 10 meters:
Lp(A)= 63 +10log 2/4π5² = 63-28= 35 dB(A)
In pressure/flow diagrams or in the table of
technical data there are facts about highest tem-
perature of transported air.
All motors have insulation class F which
means that the thermal contact disconnects the
power when the winding temperature is maxi-
mum 155°C. At this winding temperature the
life time of the ball-bearings is not optimal. This
is why the ambient temperature is shown at a
lower winding temperature so the life time of
ball-bearings becomes optimal.
The winding temperature variates in the
diagrams and depending on differences in
power/current consumption. The temperatures
in our diagrams are given at the highest winding
temperature.
Temperature of transported air
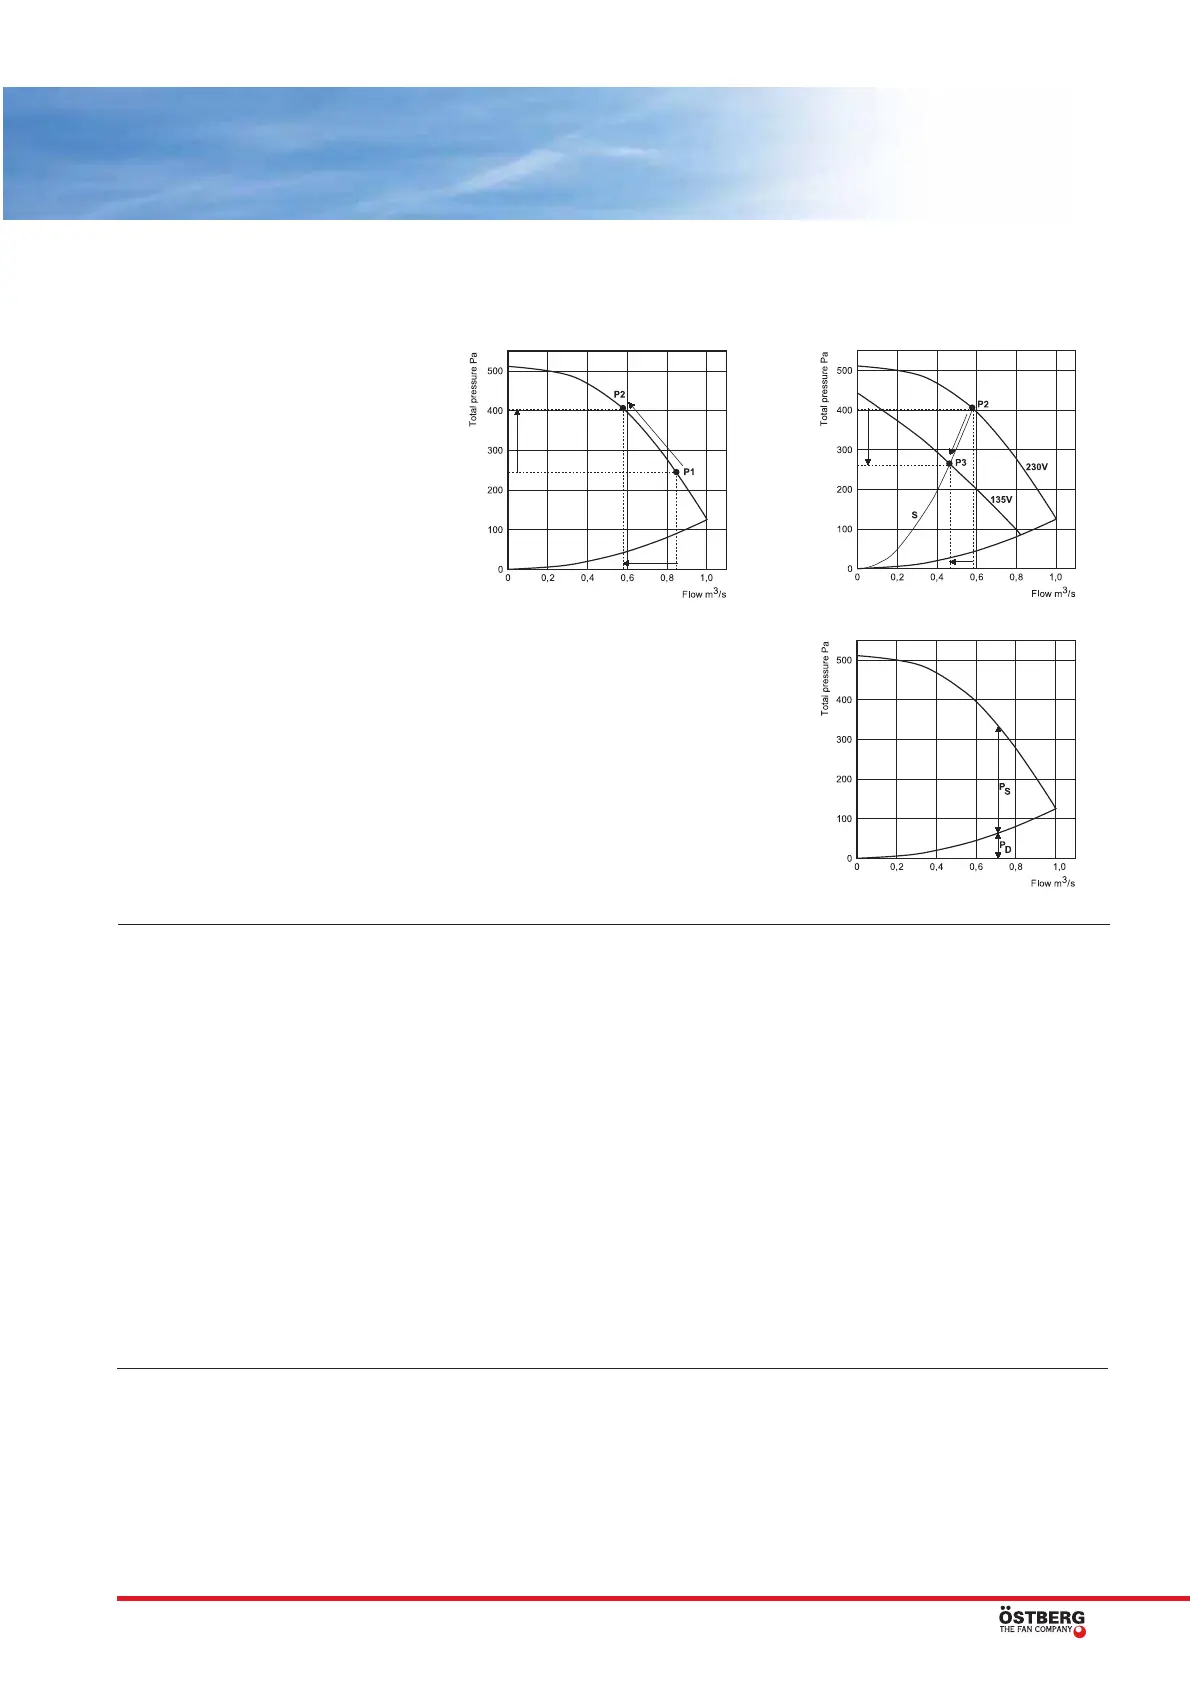
FIG. 1:
The fan curve describes the capacity of the fan,
i.e. the flow of the fan at different pressures at a
certain input voltage.
The fan diagram has the pressure in Pascal,
Pa, on the vertical axis and the flow in cubic
metres per second, m
3
/s, on the horizontal axis.
The point on the fan curve showing the
current pressure and flow is called the fans wor-
king point. In our example it is marked with P.
If the pressure increases in the ducts, the
working point moves along the fan curve and
hence a lower flow is obtained. In the example
the working point would move from P1 to P2.
FIG. 2:
The system line describes the total behaviour of
a ventilation system (ducts, silencers and valves
etc.).
Along this system line, S, the working point
is moved from P2 to P3 as the rotational speed
is changed.
Distinct voltage steps with eg. a transfor-
mer produces different fan curves, 135 V and
230 V, indicated in the example.
FIG. 3:
Our fan curves present the total pressure in
Pascal. Total pressure = Static + Dynamic pres-
sure.
The static pressure is the pressure of the
fan compared to the atmospheric pressure. It is
this pressure that shall overcome the pressure
losses of the ventilation system.
The dynamic pressure is a calculated pres-
sure that arises at the outlet of the fan, and is
mostly due to air velocity. The dynamic pressu-
re thus describes how the fan is working. The
dynamic pressure is presented with a curve,
starting at origo, that increases with increased
flow. A high dynamic pressure can with wrong
duct connection produce a high pressure loss. If
the pressure loss in the system is known, a fan
whose difference between the total and the
dynamic pressure corresponds to the pressure
loss in the system must be found.
Pressure/flow-curves explanation
FIG. 1:
FIG. 2:
FIG. 3:
 Loading...