70Xi Cold Flow Properties Laboratory Analyzer User Guide
16
3. Control Charts and Trend Graphs
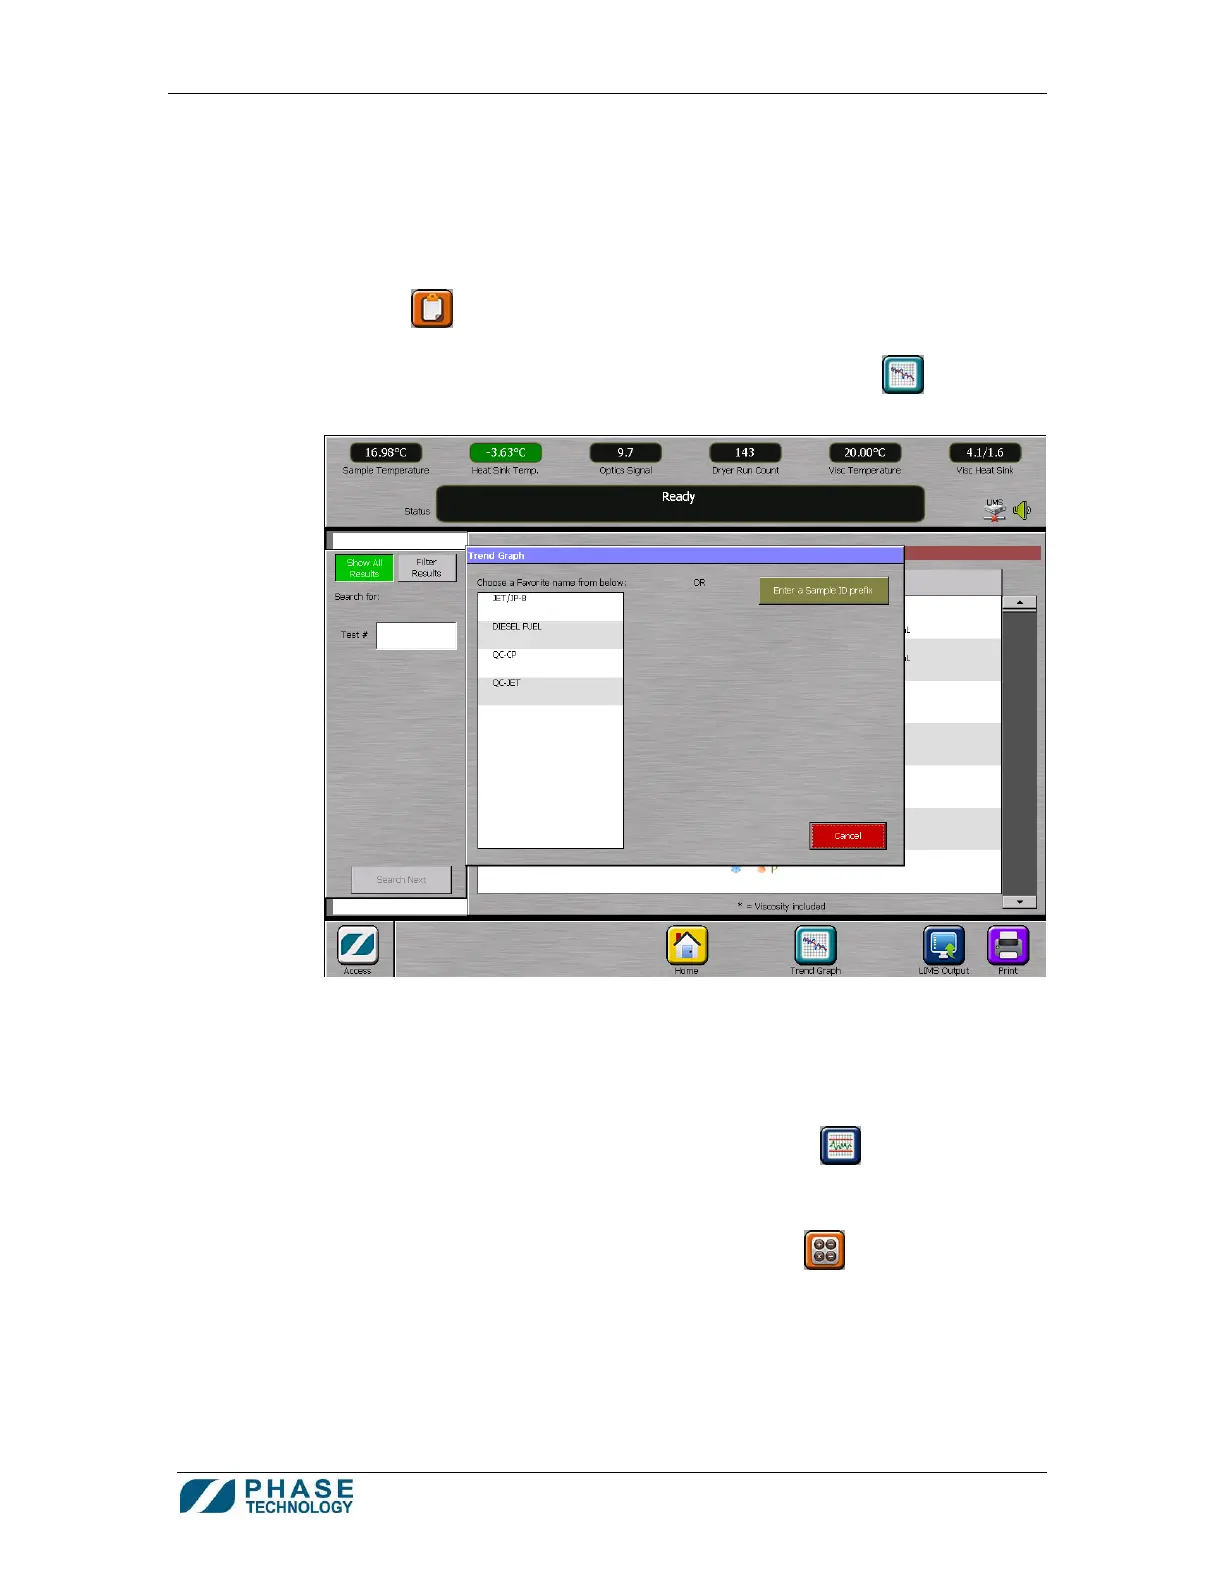
a. Trend graphs (i.e. time vs. test results graph) can be constructed for both QC and non-
QC samples. Such a plot illustrates the test results of a particular sample (of a specific
sample ID) over time, and can serve as a trending plot.
b. To generate a control chart (for a QC sample) or a trend graph, press RESULTS
HISTORY
from the Home screen.
c. From the Results History screen, press the TREND GRAPH button
. The Trend
Graph panel appears.
d. Select the sample in the list box, or enter the desired sample ID to generate the control
chart or trend graph for that sample.
e. Once the control chart or trend graph is generated, the phase plot for any result on the
chart or graph can be opened simply by touching the data point on the graph.
f. The QC Control Limits and Sample Specifications button
accesses those
screens directly from the trend graph screen (for administrators only)
g. In the case of QC control chart, the analyzer can also calculate the control limits
automatically by pressing the CALCULATE LIMITS button
. Follow the on-screen
instructions to identify outliers before actual calculation.
NOTE: a minimum of 20 data points are required for the automatic control limits
calculation.