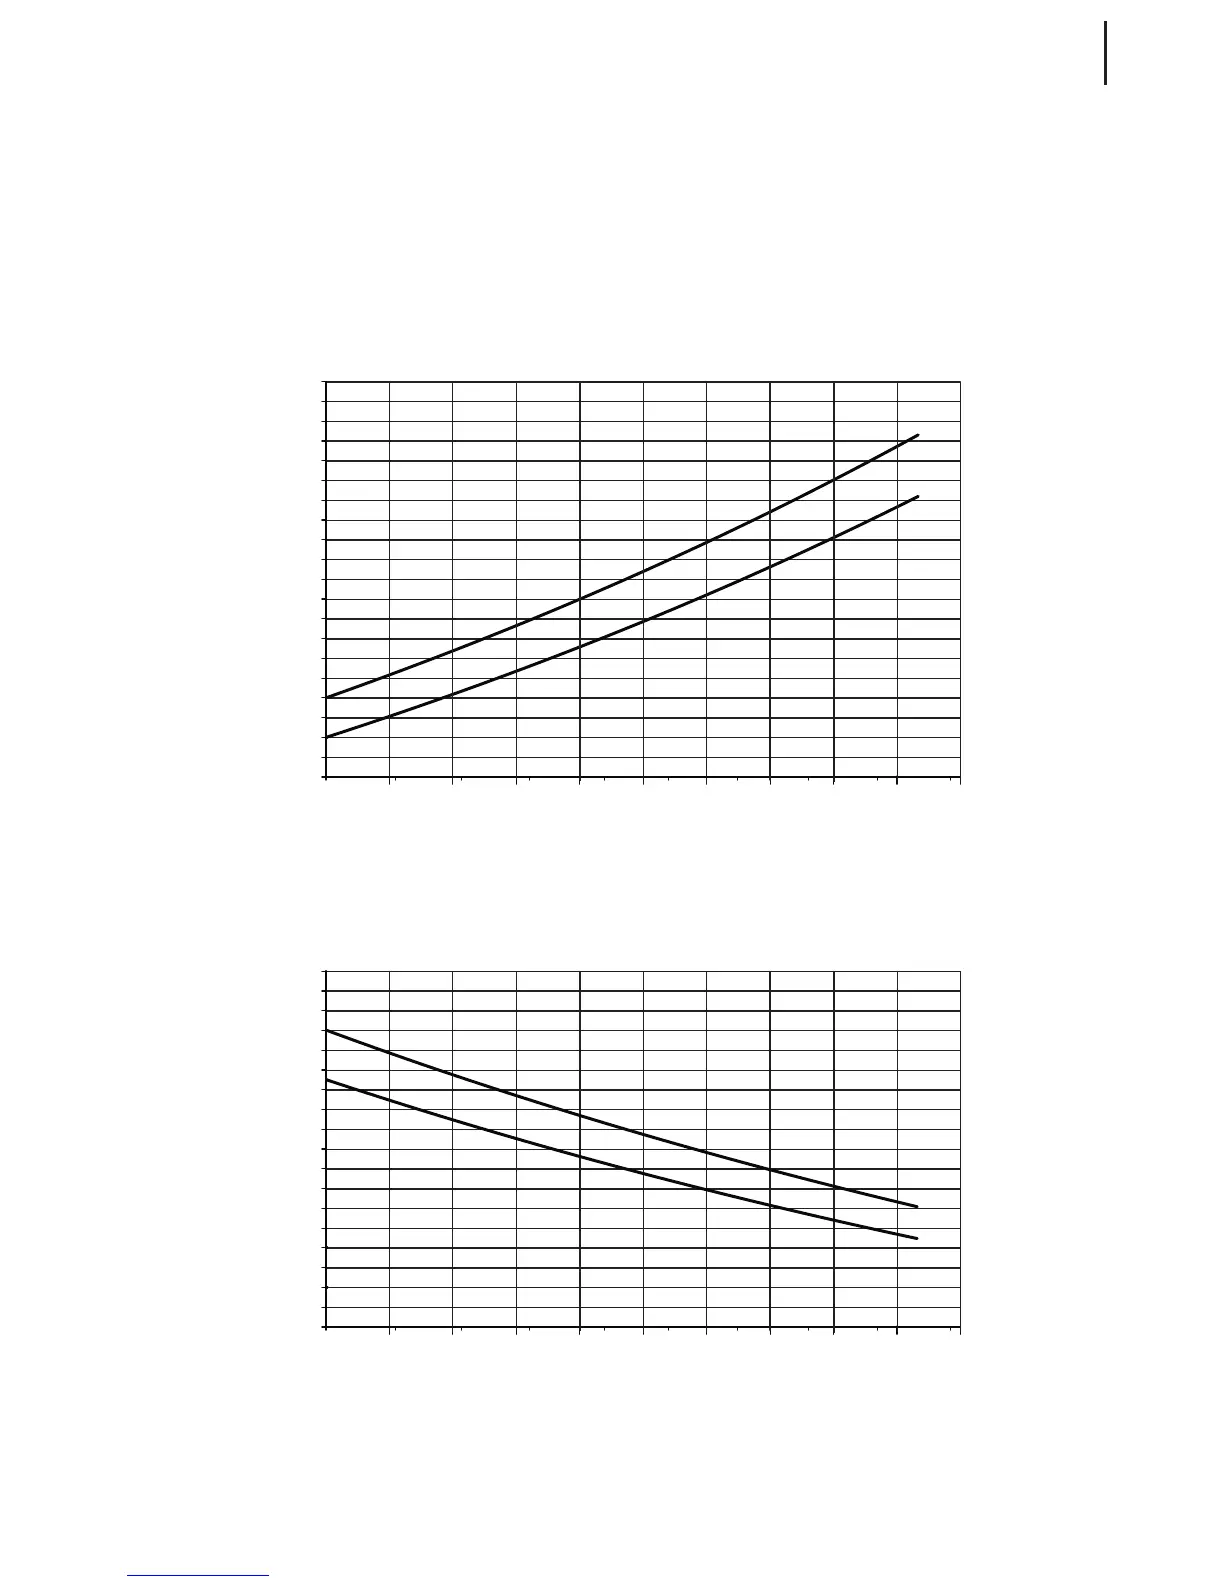
The graph below shows which indicated airspeed (IAS) must be maintained to keep the true air-
speed (TAS) constant Note that true airspeed (TAS) is constant along the entire servicable altitude
range! (VNE for Virus is 249 km/h (134 kts) TAS. Note how VNE decreases at higher altitudes!)
IAS & TAS graphs (standard ICAO atmosphere)
WARNING! Above pressure altitude of 1000 meters (3300 ft) all speed limits (see
previous page) MUST be treated as True AirSpeed (TAS).
Indicated AirSpeed (IAS) MUST be reduced accordingly (see graphs above)!!!
Hint: You can draw your own lines for other speeds on these graphs. At 0 meters (0 feet) start at the desired
IAS (1
st
graph) or TAS (2
nd
graph) and follow the same line curvature.
The graph below shows how TAS changes in relation to pressure altitude. Note that the indicated air-
speed (IAS) is constant along the entire servicable altitude range!
(Vmax for Virus is 240 km/h (130 kts) TAS)
dierence between IAS and TAS. Be aware of this eect especially when ying at high altitude at high
speeds, not to exceed VNE unawarely. Bear in mind this can happen even with the indicator still pointing
within the yellow arc! However, for ight planning purposes TAS is the most accurate speed, which then
can be corrected by eventual tail/head wind component to obtain the aircraft’s ground speed (GS).
 Loading...