41
VIRUS
www.pipistrel.si
REV. 0
Eect of elevation
The table below provides data about the eect of elevation on takeo runway length.
elevation (m) 0 500 1000 1500
atmosph. pressure (hPa) 1012 954 898 845
outside temperature (°C) 15,0 11,7 8,5 5,2
Takeo runway length [m (ft)]
Model 912 95 (310) 119 (390) 146 (475) 170 (565)
WARNING: If the outside temperature is higher than the standard value it is mandatory to
consider the takeo runway length prolongs as follows: L = 1,10 • (L
h
+ L
t
- L
0
).
Abbreviations are as follows:
L
h
= takeoff runway length at present elevation,
L
t
= takeoff runway length at sea level at same atmospheric conditions,
L
0
= takeoff runway length at 15°C.
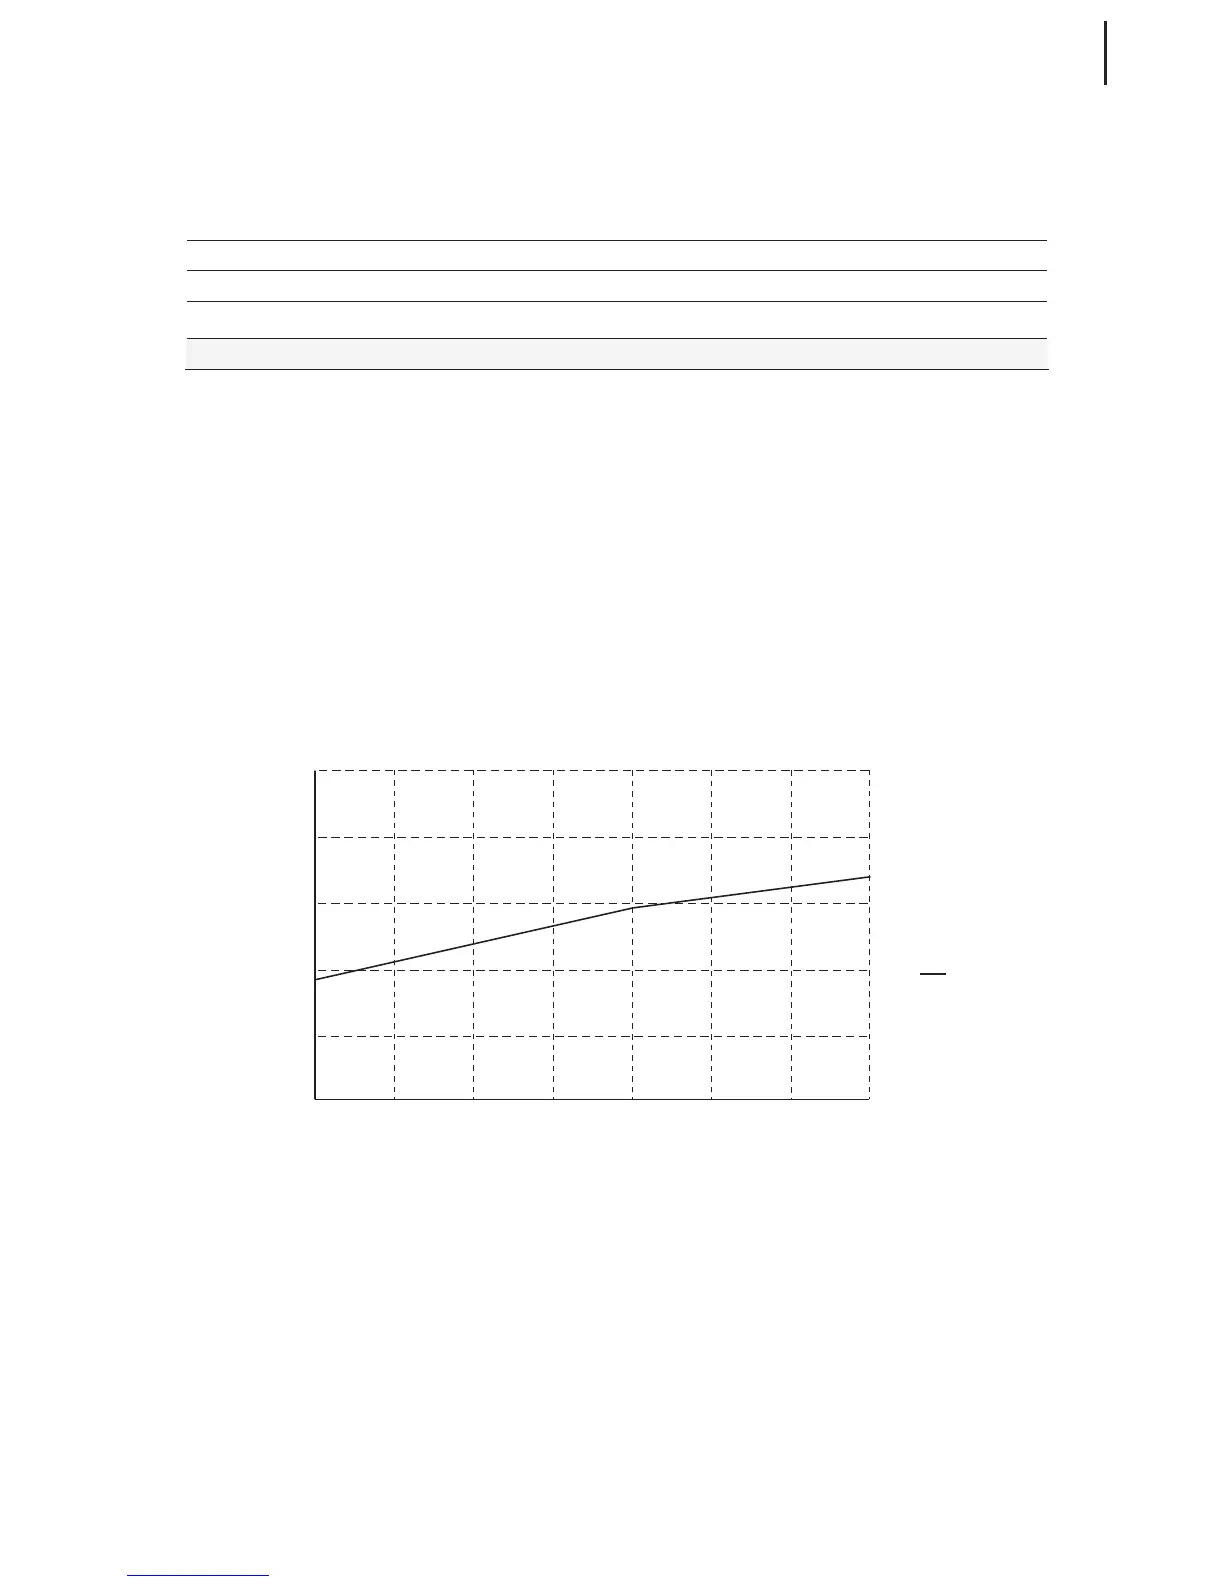
The graph below indicates how takeo runway length changes as altitude increases.
Eect of the wind
Wind (head, cross or downwind - also called tailwind) aects aircraft’s ground speed (GS).
Headwind on takeo and landing causes the Takeo and Landing runway length to shorten as the
GS is smaller during these two ight stages. The opposite stands for tailwind on takeo and landing
as tailwind prolongs Takeo and Landing runway length signicantly.
The data on the next page was obtained through testing and therefore serve as informative values
only.
Performance
 Loading...