Performance
Introduction
This chapter provides information on aircraft’s airspeed calibration, stall speeds and general per-
formance. All data published was obtained from test ight analysis. Test pilots were instructed to
control the plane simulating average pilot’s ying skills.
Airspeed indicator calibration (IAS to CAS)
Pitot tube’s ingenious mounting and construction makes IAS to CAS correction values insignicant.
Therefore pilots should regard IAS to be same as CAS. IAS = CAS.
Stall speeds
Stall speeds at MTOM are as follows:
aps in negative position; -5° (up): 76 km/h (41,0 kts)
aps in neutral position; 0° (neutral): 72 km/h (39,2 kts)
aps in 1
st
position; +9° (down): 68 km/h (36,3 kts)
aps in 2
nd
position: +18° (down): 64 km/h (34,5 kts)
Take-off performance
All data published in this section was obtained under following conditions:
aircraft at MTOM
elevation: 100 meters (330 feet)
wind: calm
runway: dry grass runway with low-cut grass
ICAO standard atmosphere
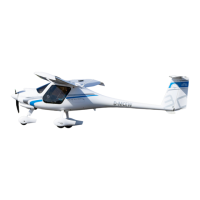
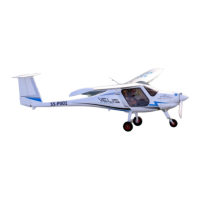
Virus Model 912
takeo runway length at MTOM (VARIO prop.) 95 m (310 ft)
takeo runway length (over 15 m obstacle) 172 m (565 ft)
Note: in order to meet the data for takeo runway lenght over 15 m obstacle maintain Vx
after take-o.
Takeo runway length may vary depending on the wind, temperature, elevation and
wing & propeller surface condition.
 Loading...