+10ºC
+1ºC
-2ºC
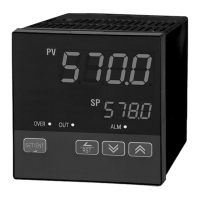
The original temperature is shown within the range of 0ºC (Range Low) and 100ºC (Range High).
Bias points have been used to adjust the displayed temperature as shown in the graph in Fig 1.
To establish this bias, the settings are shown below.
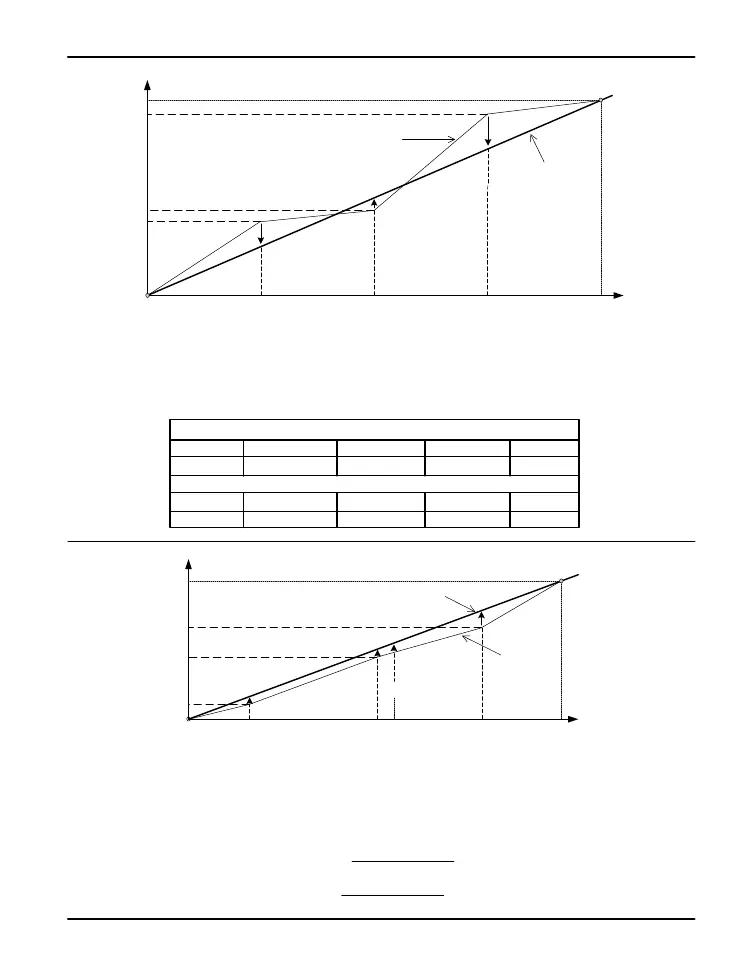
Temperature Bias Value (BS0 through BS4) = Temperature After Bias - Actual Temperature
Display temperature after bias at 600ºC actual temperature = P
Fig 2: Bias Formula Calculation
Original
Temperature
Temperature After Bias
0ºC = BS0
10ºC = BS1
10ºC = BS2
50ºC = BS3
0ºC = BS4
BSP1
BSP2 BSP3RL RH
Original
Temp
Fig 1: Temperature Bias
0ºC = BS0
RL BSP3 RHBSP1 BSP2
Original Temperature
Temperature
After Bias
BS4
75ºC0ºC
25ºC
50ºC 100ºC
-3ºC = BS3
-2ºC = BS1
+1ºC = BS2
0ºC = BS4
-3ºC
Example 1:
Temperature Settings to Establish Where the Bias Occurs
RL BSP1 BSP2 BSP3 RH
0ºC 25ºC 50ºC 75ºC 100ºC
Bias Offset for Each Point
BS0 BS1 BS2 BS3 BS4
0ºC -2ºC +1ºC -3ºC 0ºC
P = 600 + (600 - BPS2) x
BSP3 - BSP2
BS3 - BS2
+ BS2
Example 2:
600ºC -
100ºC0ºC 500ºC 800ºC 1000ºC
+10ºC
+PºC
+50ºC
P = 600 + (600 - 500) x
800 - 500
50 - 10
+ 10 = 623ºC Temperature After Bias
PD570 Series Nova Process and Temperature Limit Controller Instruction Manual
16