22
/
48
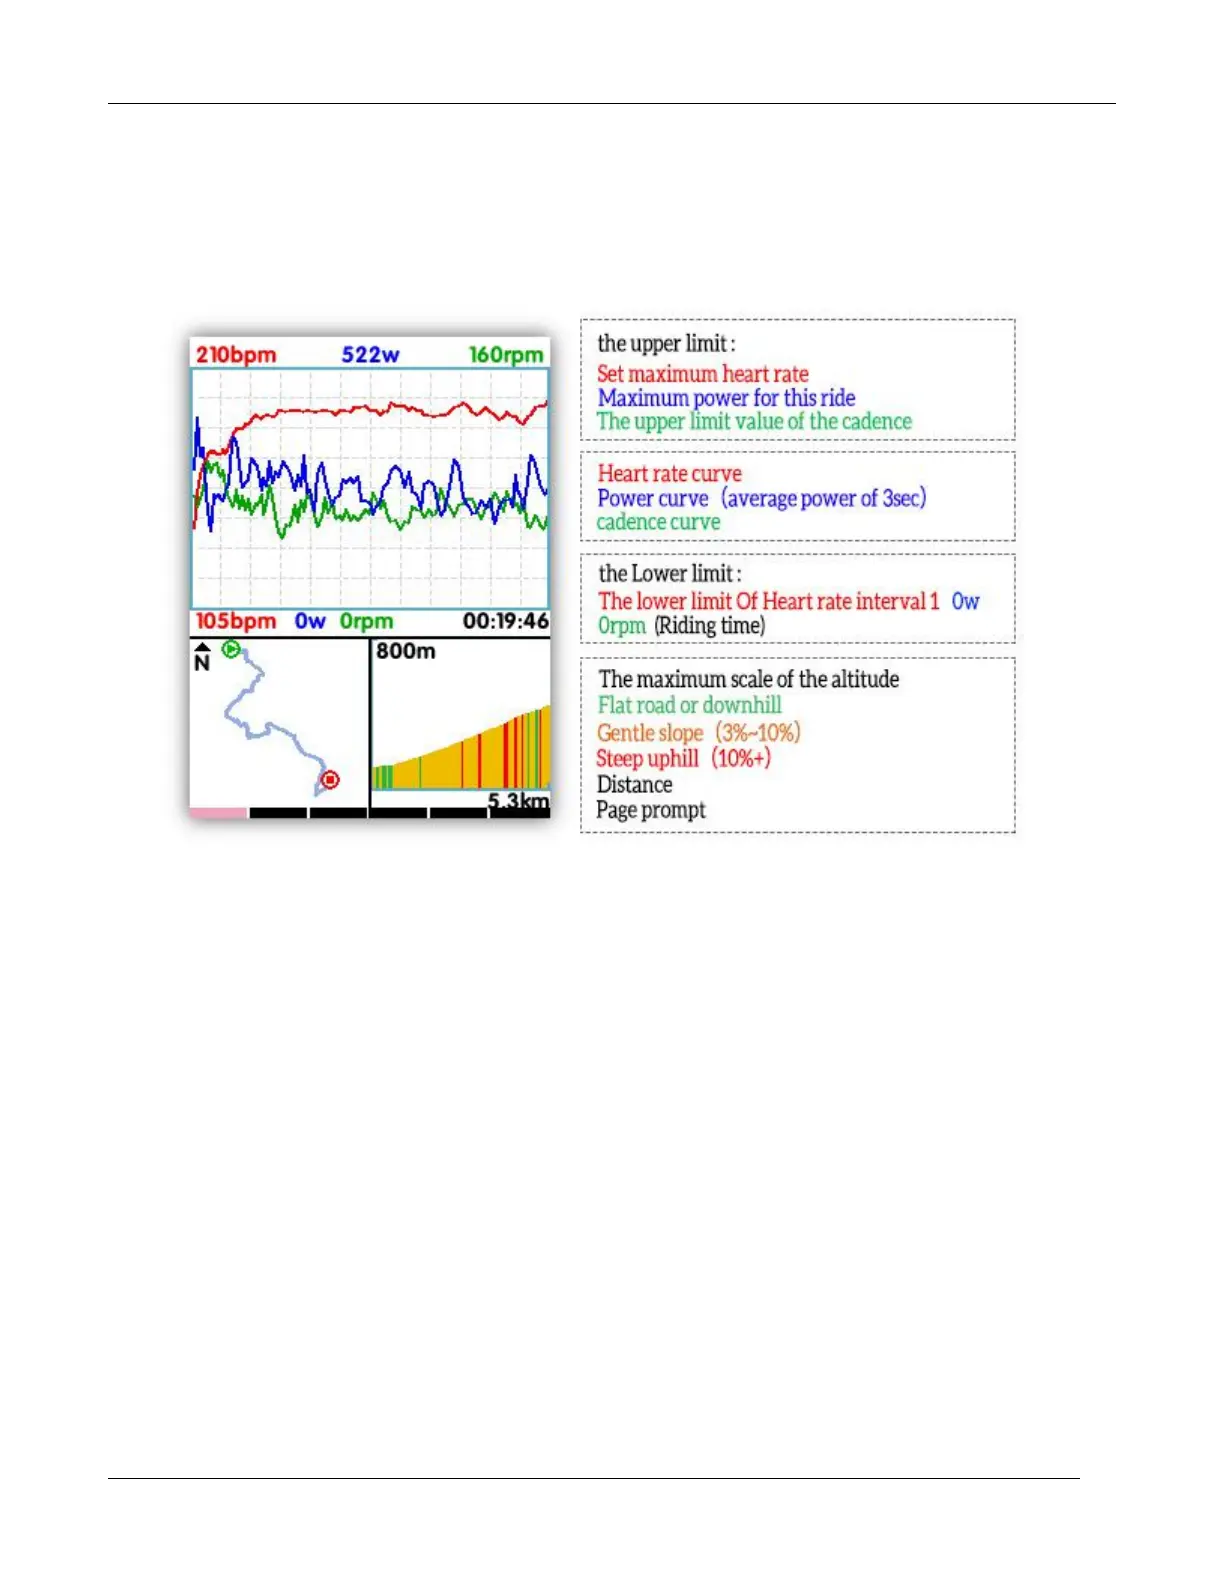
Summary chart: data curve, route diagram and altitude diagram.( as below picture)
Graph of Heart rate zones: show the time of 5 heart rate zones( only supported in Firmware
V1.05 or above) and the average and max heart rate.
Graphic of power zones: show the time of 7 power zones ( only supported in Firmware
V1.05 or above) and the NP and max power. It will show the average power if the NP is
invalid.
Graph of cadence zones: show the time of 6 cadence zones( only supported in Firmware
V1.05 or above) and the average and max cadence.
Note:
1. there will be no graphic if item data are invalid( no heart rate or power graphic if have
not connected with heart rate sensor or power meter).

 Loading...