Ta ke your photos and data as described above
and save them by pressing disc buttoninto the
same file as before.
The number of inspections is shown in the bot-
tom line of the window
To see changes of the temperature over time,
you can create a routing graph.
This feature is very useful to monitor measure-
ment points over time and identify problematic
trends.
For instance, in electrical panels, it is difficult to
find out that something is outside the normal
temperature range, especially if the panel has
live voltage. If you monitor the panel over time,
you find out, where the problems are, before
they become dangerous.
Go to
and then open the logger file you have just
created.
25
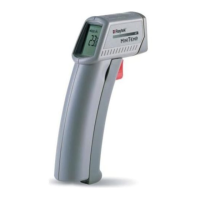
Expert Mode
24
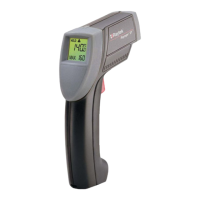
Expert Mode
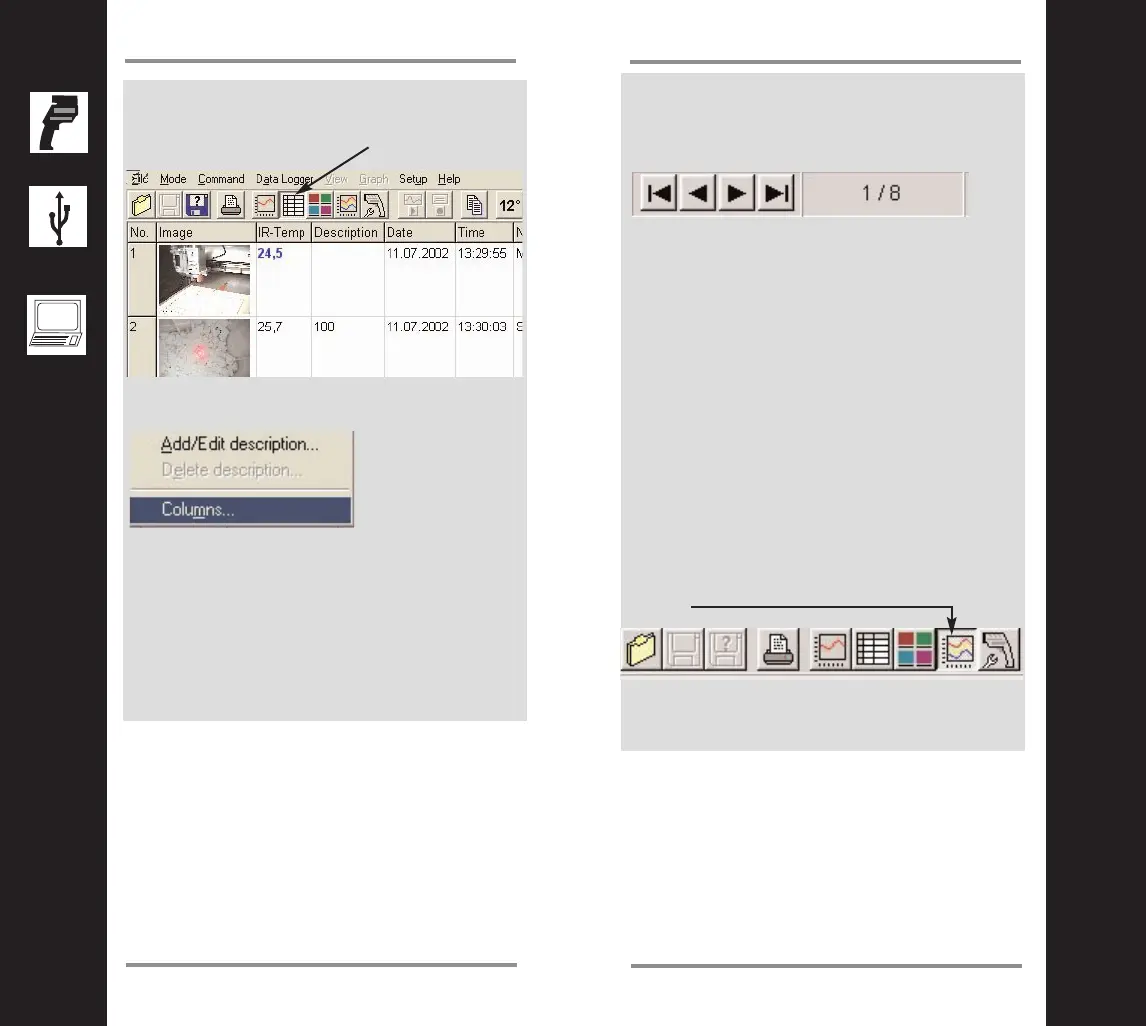
The photos and data appear in a thumbnail pre-
view. To see the table click here.
With a right click into the table you open a sub
menu.
By choosing “Columns” you can add or delete
columns to show all the data you have saved.
Save the data. This will delete the unit’s
memory and the unit is now ready for the next
inspection.