CONTROL METHODS HeatNet Control V3
Page 19
The reason for this is to keep the continuity of BTUs linear
without a BTU bump (discontinuity) when boilers are added
or shed. The Mod Max % can be adjusted to the high side to
allow for tolerance (about 10%) as is indicated in the tables.
This is illustrated in the Boiler System Response 2 graph.
If redundancy is not required, the min inputs of the
Priority 1 boilers may be summed to lower the Mod Max %
value so smaller Priority 1 boilers can be used. The sum of
the min inputs would then need to be divided by the sum of
the Max Input of the Priority 1 boilers. The effect of this
would create a higher turndown. See: EXCEPTION NOTES:
Mod MAX % =
(((Priority 1 Min) * (#Priority 1’s)) + Priority 2 Min)
Max Input of Priority 1 boiler * (#Priority 1’s)
Example: (2) CK 1500, (2) CK 2500
Redundancy: (300 + 500)/1500 = 53%
No Redundancy: (300 * 2) + 500) / (1500*2) =36%
In this example, if “Redundancy” is used, the variable “# of
Priority 1’s” is not used.
EXCEPTION NOTES:
1. Mixing more than two different size/type boilers
becomes more complex than the scope of this manual
and is not recommended.
2. If using more than one Priority 1 boiler and the
calculated value is <
Priority 1Min * 2
Priority 1 Max Input
Use this result PLUS note 3 value as the
ModMax %.
3. Always add a few % (3-5%) to the calculated MOD
MAX % value to allow a guard band (tolerance).
4. If boilers are of different sizes, try to use larger Priority
2 boilers.
If the calculated Mod MAX % value is greater
than 99%, the combination cannot be used
since short cycling will occur.
Once the Priority 1 and Priority 2 boilers are selected, they
can be multiplied in each Priority set to achieve the desired
system design BTUs. If the # of boilers becomes a large
number, a Priority 1 boiler with a higher Min Input may
need to be selected.
While considering the MOD-MAX value, the lower the
MOD-MAX the greater the combustion efficiency since it
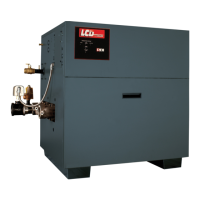
effectively limits the input rate. The Typical Efficiency of
Non-Condensing Boilers chart can help illustrate how the
MOD-MAX value can affect the efficiency by limiting the
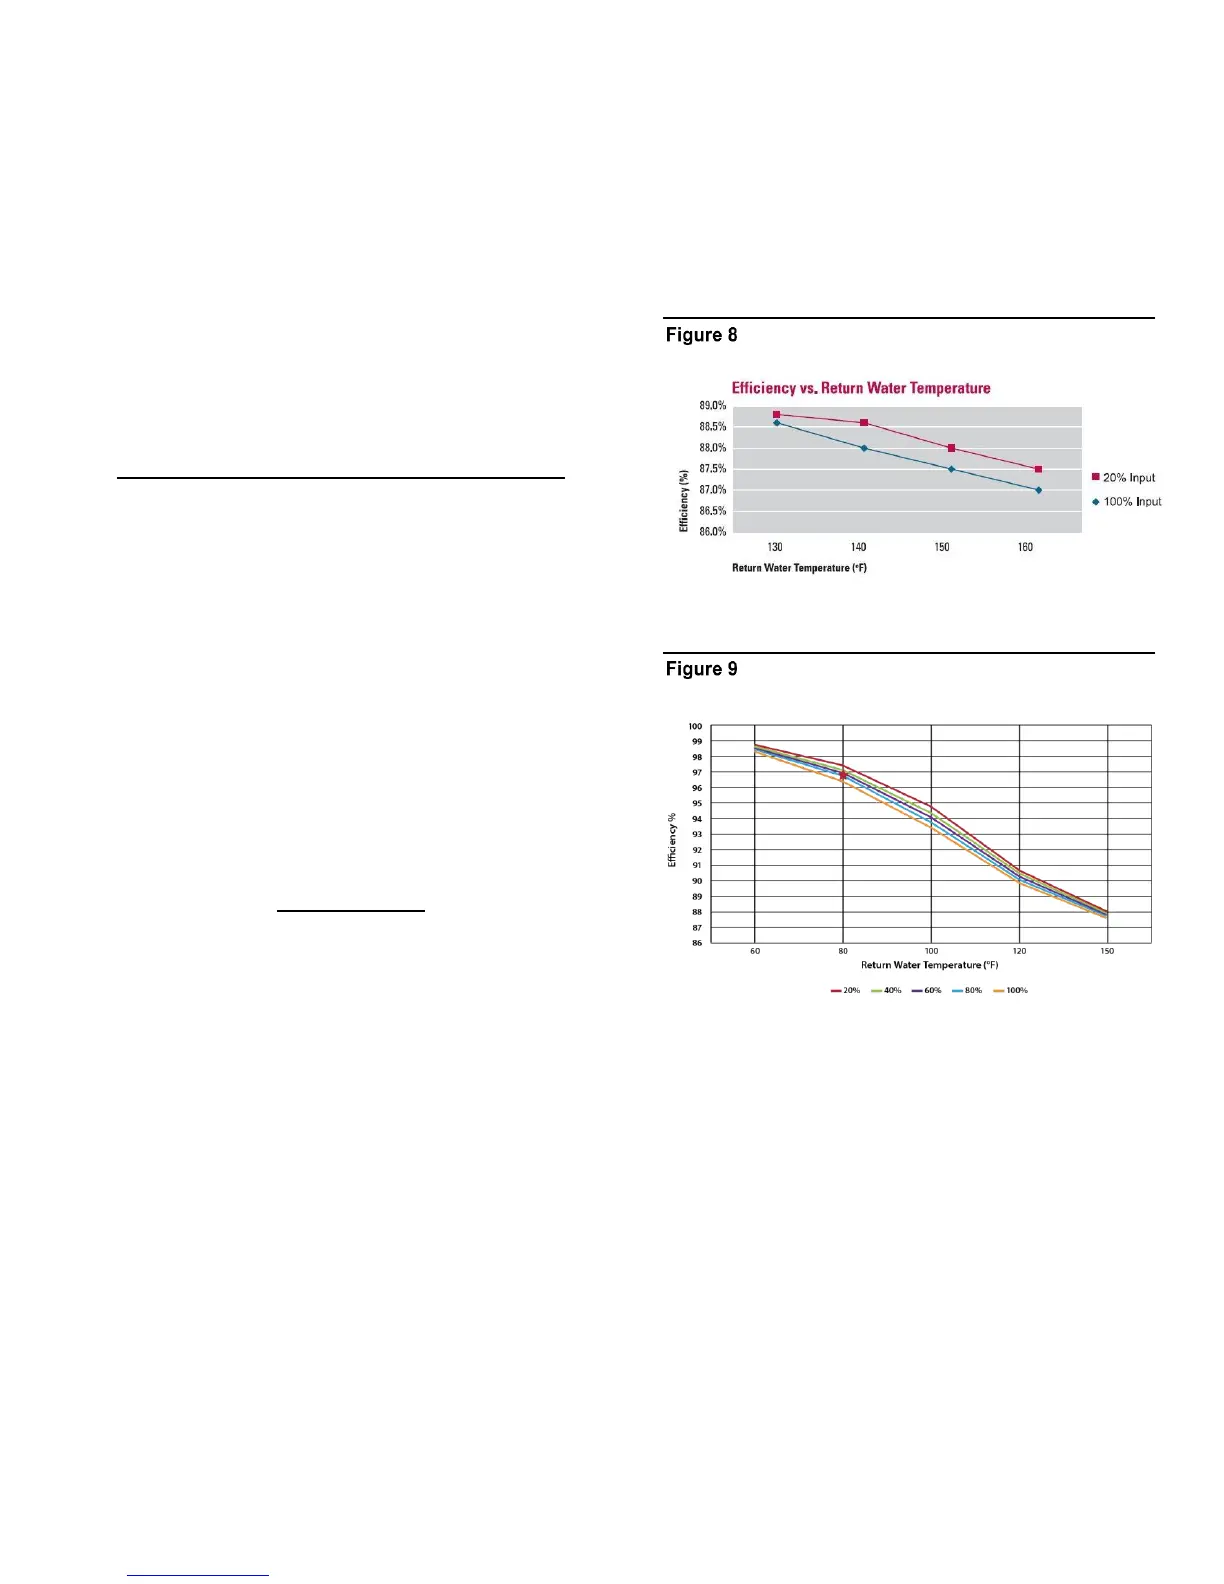
input until all boilers have fired. Non-condensing boiler
efficiency is relatively flat compared with condensing as
illustrated in the Typical Efficiency of Condensing Boiler
graph.
Typical Efficiency of Non-Condensing Boilers
Typical efficiency of Flexcore boilers
In the Mixed Boiler System table line 1 example, (2) CK
1500s are set as Priority 1 and (2) CK 2500 boilers are set
as Priority 2. With a MOD MAX of 50% (Redundancy),
each 1500 can run to 750M (1500M total) before a 2500 is
called ON (Add Delay timer). Once both 1500s are running
and the 2500 is called on, all (3) boilers will drop to a sum
of 1500M BTUs: Taking this1500M value and dividing by
total M BTUS of the (3) boilers, 1500 +1500+1750 = 5500,
we get 27.27%. (.2727* 1500M) + (.2727* 1500M) +
(.2727* 2500M) or: 409M +409M + 681M = ~1500M and
operate at higher combustion efficiencies
 Loading...