2: Data Data editor screen.
3: Sum Summation submenu.
4: Var Submenu of statistical variables.
5: Reg Regression submenu.
6: MinMax Submenu of minimums/maximums.
3: Edit Submenu of command editing:
[Ins]
,
[Del-A]
.
5: Distr Distr submenu with commands for the calculation of normal
distribution.
To view or change the data, choose one of the options 1 to 3. Options 4 to
6 serve for the selection of required variables of data analyses. Values of
statistical variables depend on inserted data.
Attention!
The choice number
may differ and some choices may be missing according to situation (e.g. Edit,
Distr, MinMax).
You can retrieve them by means of the below-specied commands:
Statistics of one variable:
Σx
2
[3](SUM)[1] Sum of all x
2
values.
Σx
[3](SUM)[2] Sum of all x values.
n
[4](VAR)[1] Number of inserted x values.
[4](VAR)[2] Average of x values.
xs
n
[4](VAR)[3] Standard deviation of x values.
xs
n–1
[4](VAR)[4] Sample standard deviation of x values.
minX [6](MinMax)[1] Minimum of the x value.
maxX [6](MinMax)[2] Maximum of the x value.
Distr submenu:
P ( [5][1]
Q ( [5][2]
R ( [5][2]
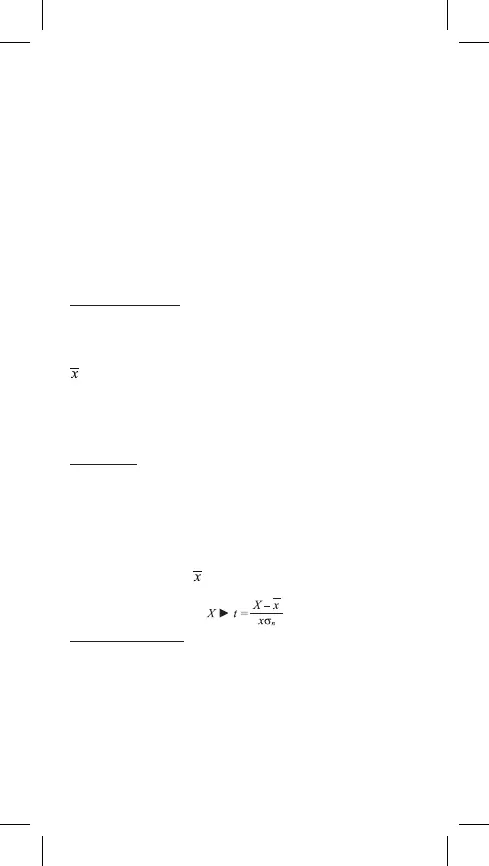
→ t [5][4]
This menu may be used to calculate probability of standard normal distribution.
Normalized random variable t is calculated by means of the expression shown
below with average value of
and value of standard deviation of the le xs
n
that
is obtained from data entered on the screen in the STAT editor.
Statistics of two variables:
Σx
[3](SUM)[2] Sum of all x or y values.
Σy
[3](SUM)[4]
Σx
2
[3](SUM)[1] Sum of all x
2
or y
2
values.
Σy
2
[3](SUM)[3]
Σx
3
[3](SUM)[6] Sum of all x
3
or x
4
values.
Σx
4
[3](SUM)[8]
Σxy
[3](SUM)[5] Sum of pair (x • y) variables x–y.
14–EN

 Loading...