124
33
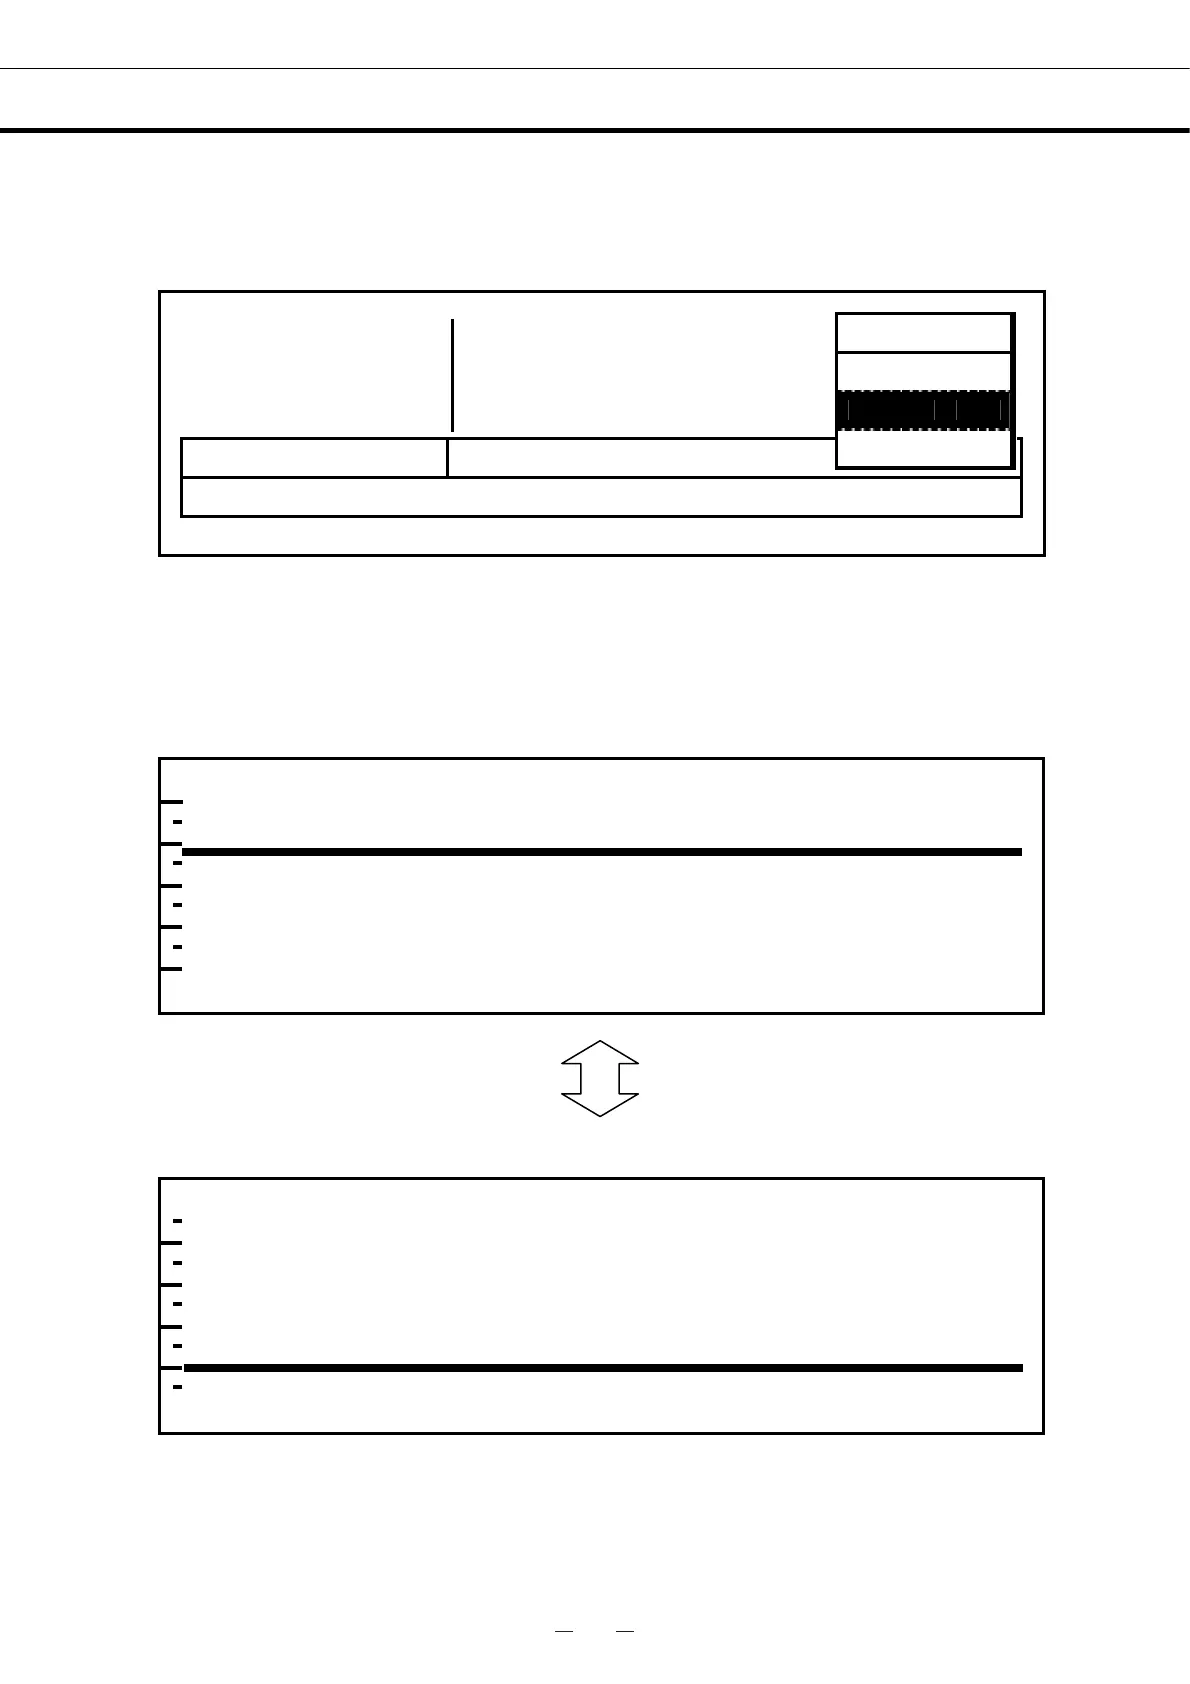
DISPLAYING THE LOG㩷
㩷
A log of the past chamber temperatures and CO
2
densities can be displayed on a graph.
㩷
1. Press the MENU Key from the Top Display to display the menu, select Log and press the ENTER Key.
㩷
㩷
㩷
㩷
㩷
㩷
㩷
㩷
㩷
㩷
㩷
2. The log will be displayed with dots. Press the Up Cursor Key and Down Cursor Key to switch between
the temperature and CO
2
density displays. Press the Left Cursor Key and Right Cursor Key to scroll the
displayed data (Left Cursor Key: older data, Right Cursor Key: newer data).
㩷
㩷
㩷
㩷
㩷
㩷
㩷
㩷
㩷
㩷
㩷
㩷
㩷
㩷
㩷
㩷
㩷
㩷
㩷
㩷
㩷
㩷
㩷
㩷
㩷
㩷
㩷
㩷
㩷
1
T e
m p 3 7 . 0
o
C C O 2 5 . 0 %
2
3
4
5
S t a t u s
6
O K
7
㧟㧣㧜
㧡㧜
M E N U
S e t
L o g
T o o l s
1
5 0 ° C 2 0 09/03/01 T e mp
3
4
5
6
0 1 2
24
㪪㫎㫀㫋㪺㪿㪼㪻㩷㫎㫀㫋㪿㩷㪬
㩷㪸㫅㪻㩷㪛㫆㫎㫅㩷㪚㫌㫉㫊㫆㫉㩷㪢㪼
㫊
1
2 0 % 2 0 09/03/01 C O 2
3
4
5
6
0
1 2
24
Temperature
CO
2
density
 Loading...