EasyManua.ls Logo

Sencon 487 Series - Diagnostics - Graphing

Default Icon
11 pages
Print Icon
To Next Page IconTo Next Page
To Previous Page IconTo Previous Page
Loading...
7
© 2020








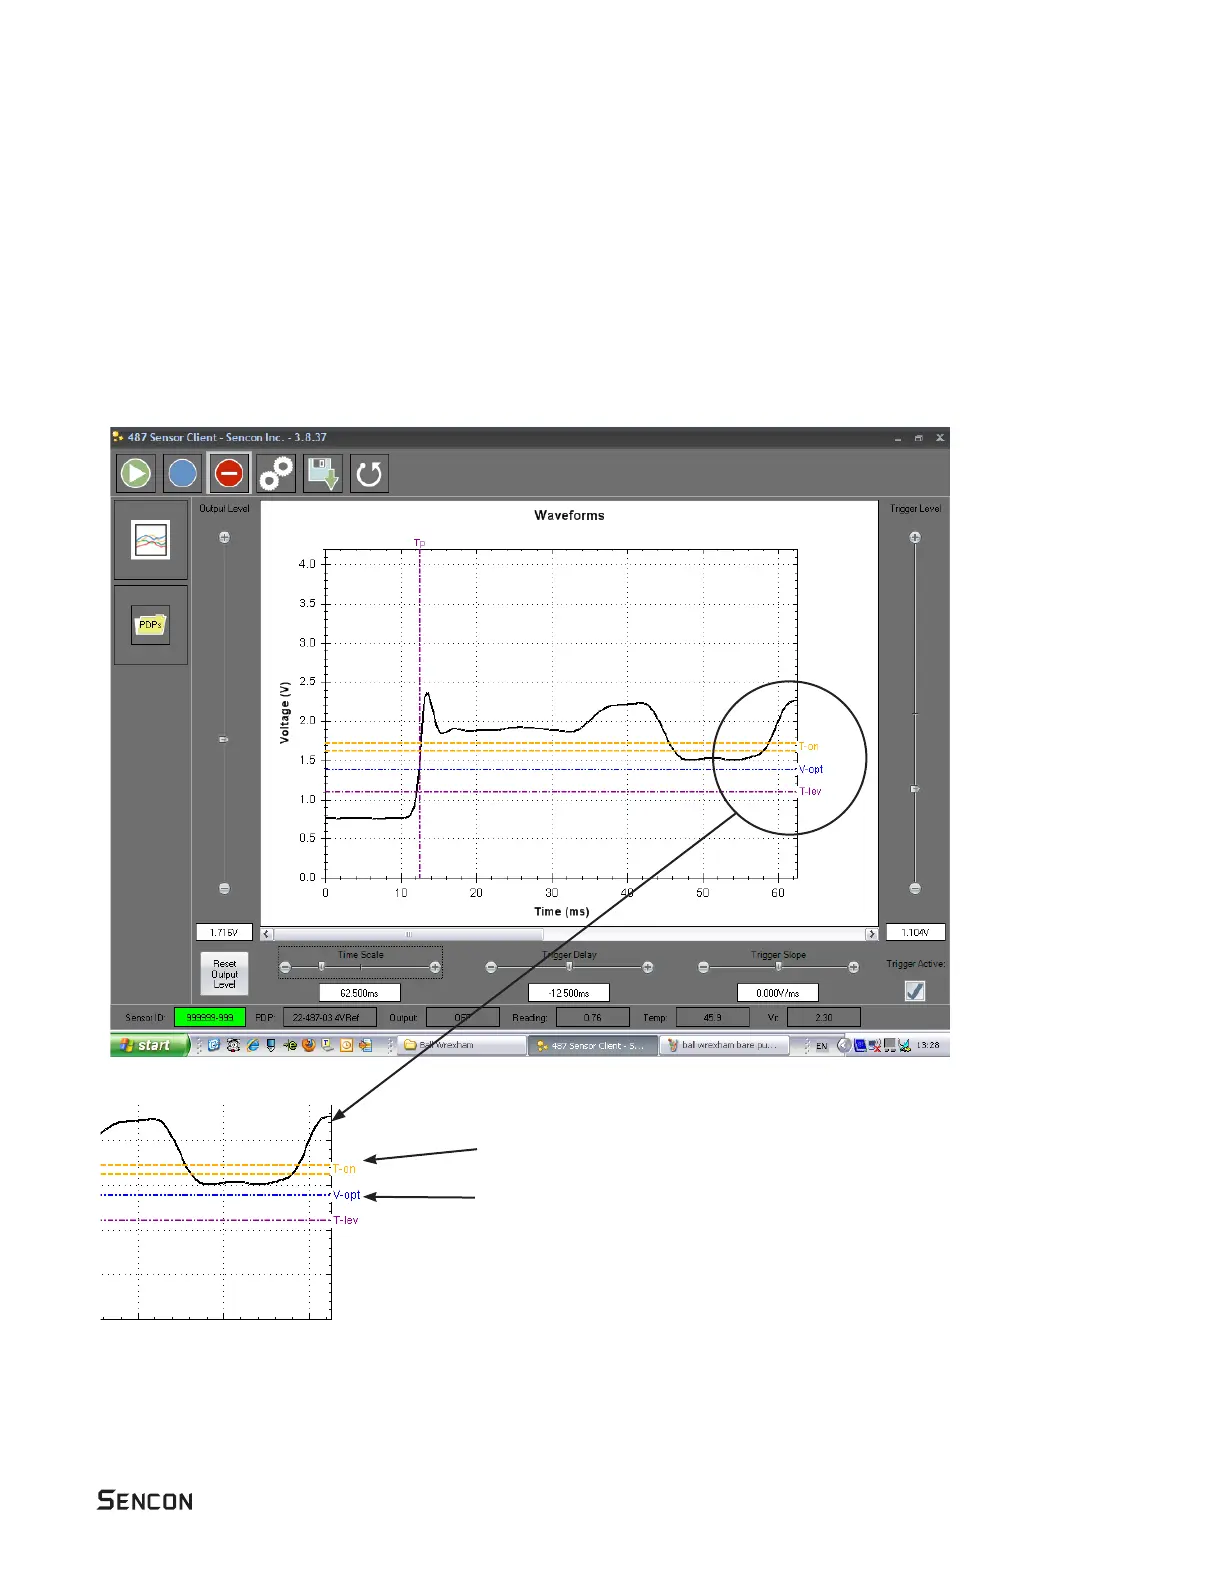
The graph trace will look something like the graph below.
Diagnostics - Graphing
T-on - Orange threshold lines – these indicate the sensors hysteresis.



gain to give 1.4 volts when it sees the bare punch.