EasyManua.ls Logo

Sencon 487 Series - Graphing Modes; Triggering

Default Icon
11 pages
Print Icon
To Next Page IconTo Next Page
To Previous Page IconTo Previous Page
Loading...
9
© 2020
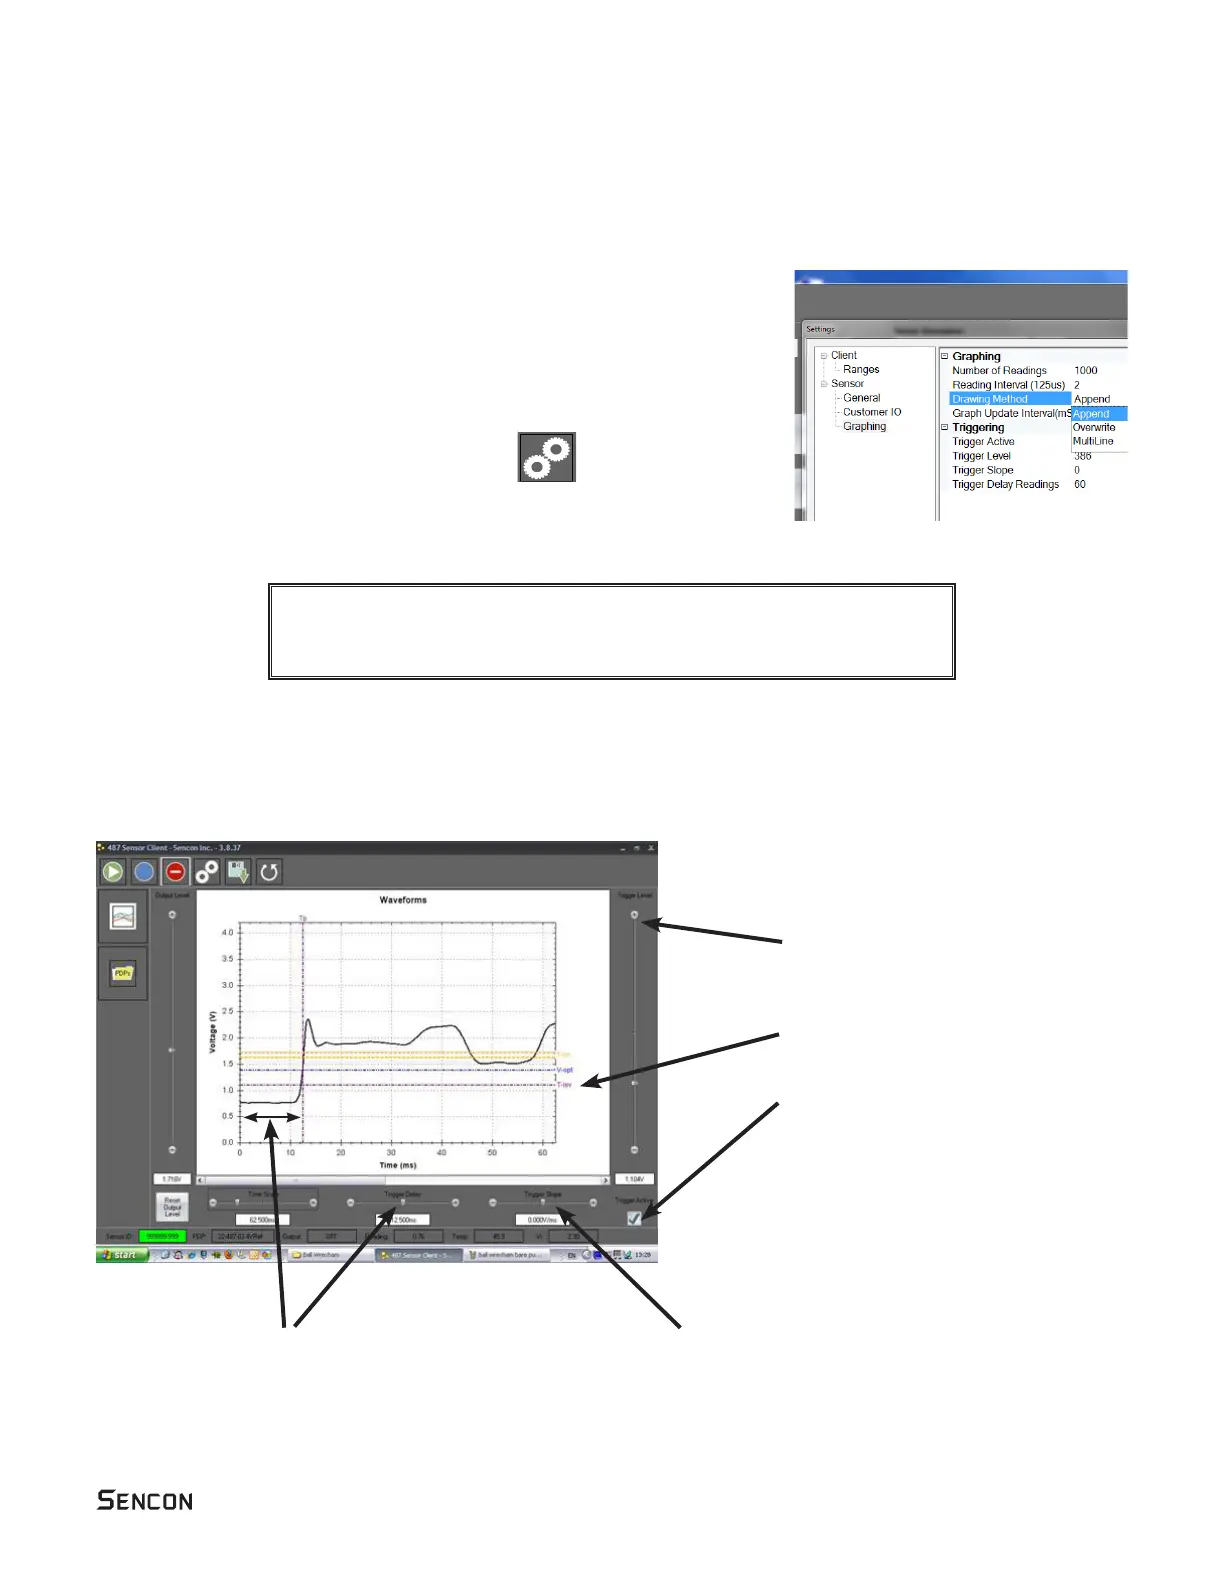
The trigger level, trigger delay and trigger slope are used to give a stable image on the graph.
They work in the way the same way as the controls on an oscilloscope.
The trigger level determins the signal level
needed to start the data display.
This is controlled by the Trigger Level
slider and is shown on the graph by the



The trigger delay allows some data already
collected to be shown prior to the trigger point.

Tp line.
The trigger slope determines whether the graph

or slope and the angle of the slope (V/ms) as the
voltage changes.


There are three modes:
Append - free running trace. This shows the live signal from the sensor
Overwrite - The trace starts at a predetermined trigger point. Only one trace
will be displayed.




Graphing modes
Triggering

read/write access. C:\Program Files (x86)\Sencon\487SensorClient
You will need administrator rights to make these changes.