EasyManuals Logo

Sharp V series User Manual

Sharp V series
30 pages
To Next Page IconTo Next Page
To Previous Page IconTo Previous Page
Page #28 background imageLoading...
Page #28 background image
27
The table below summarizes the dates in April when cherry
blossoms bloom, and the average temperature for March in
that same area. Determine basic statistical quantities for
data X and data Y based on the data table.
<Example 2>
6
21
3
<D ata table 2>
2
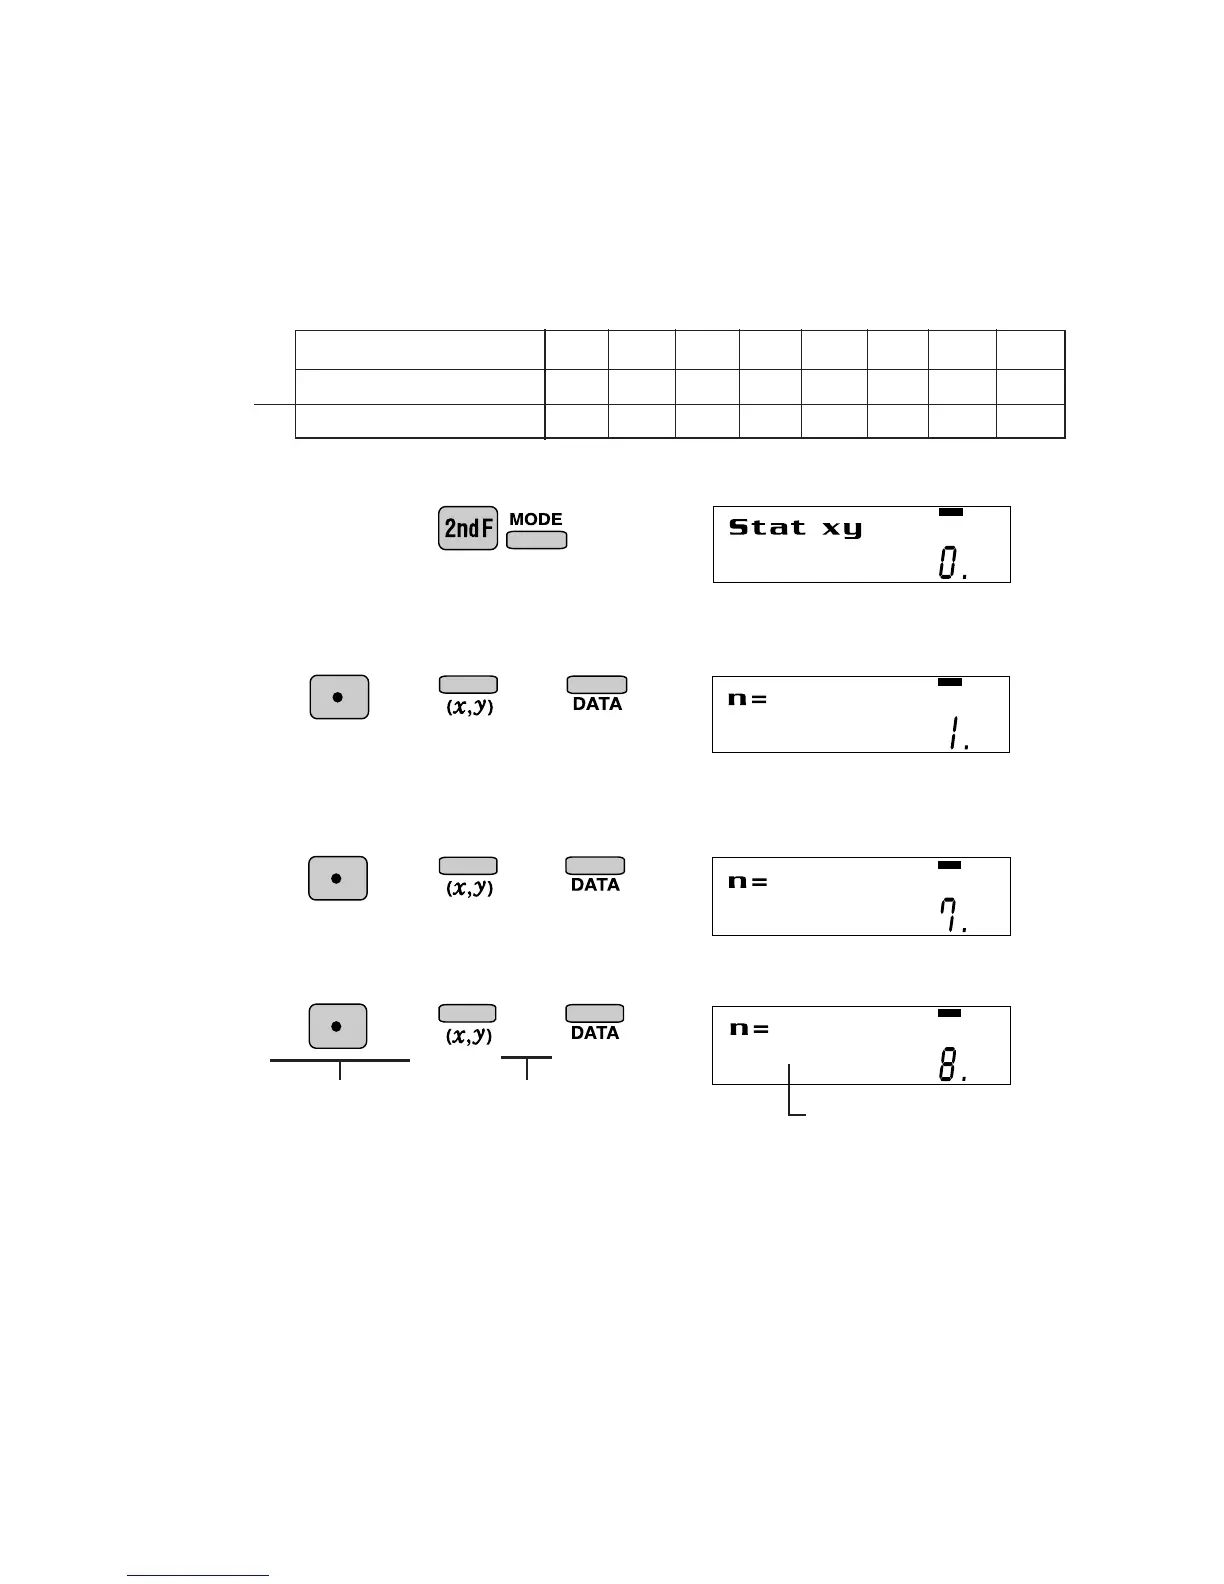
Select dual-variable statistics mode
Year 1983 1984 1985 1986 1987 1988 1989 1990
A ver age tem perature
6.2 7.0 6.8 8.7 7.9 6.5 6.1 8.2
D ate blossoms bloom
13911 5712 157
x
y
DEG
STAT
DEG
STAT
Temperature
Date
Data total up to
this point
61
15
82 7
DEG
STAT
.
.
.
.
.
.
DEG
STAT

Questions and Answers:

Question and Answer IconNeed help?

Do you have a question about the Sharp V series and is the answer not in the manual?

Sharp V series Specifications

General IconGeneral
BrandSharp
ModelV series
CategoryCalculator
LanguageEnglish

Related product manuals