Simulators
Speed
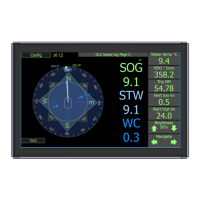
In this page it is possible to set a xed speed and to send this to the sensor. This will result in the
speed being presented on all displays and outputs. This mode is a full simulator and will verify that
all electronics and processing in the system are operational. When active an orange ‘S’ will show on
screen.
Alert
By pressing the alert simulator a typical alert will become active. this can be acknowledged as
normal, and will disapear when the simulator is removed.
If the received data does not seem to be correct, it is possible to tune the system . The system has
3 operational modes
1. Shallow water <3m, The system adjusts the sampling length to the minimum available. at some
stage the bottom factor may interfere.
2. Deeper water >3-40m, The system will adjust the sample length for bottom and water to maximalise
the accuracy
3 Very deep water>80m The bottom track (SOG) switches to a long distance mode. In this mode the
system may be susceptable to noise if there is rapid acceleration of the vessel. (small vessels are
most susceptable)
The STW value can be tuned to optimalise the performance of the system. By adjusting the STW
ping length and the ping depth, the STW can be made to be inuenced less by the vessel.
If this is changed the calibration should be monitored as it may change. These deeper values are
often better for efciency measurements
In coastal areas it is not uncommon to nd a layer of warmer fresher water on top of a lower colder
water. These layers can slide across each other in different directions and if the sensor samples
across this layer its result will be wrong. For this reason the default is to measure as close to the
vessel as possible to avoid this situation.
Currents in this lower area is often less than at the surface, if the STW reading is moved further from
the vessel then the current value will reect that area, not the area inuencing the vessel.
Logging data: If you require external help to solve a problem Data can be logged and sent to
service@skipper.no. Placing a USB stick in the JB70 unit will start the logging. You can also use the
free SKIPPER service software available at www.skipper.no to log via the network port.
In this case, connect a PC via LAN. start the communications button, and log on the UDP terminal.
To get the most out of this data, turn on the DIAG sentence in the communications setup for UDPM
on the display. The les generated, both in LAN logging and USB, log the data currently being sent
on the UDPM output. It is therefore important to turn on the DIAG output on the UDPM channel to
ensure the sensor and relevant input data is also logged.