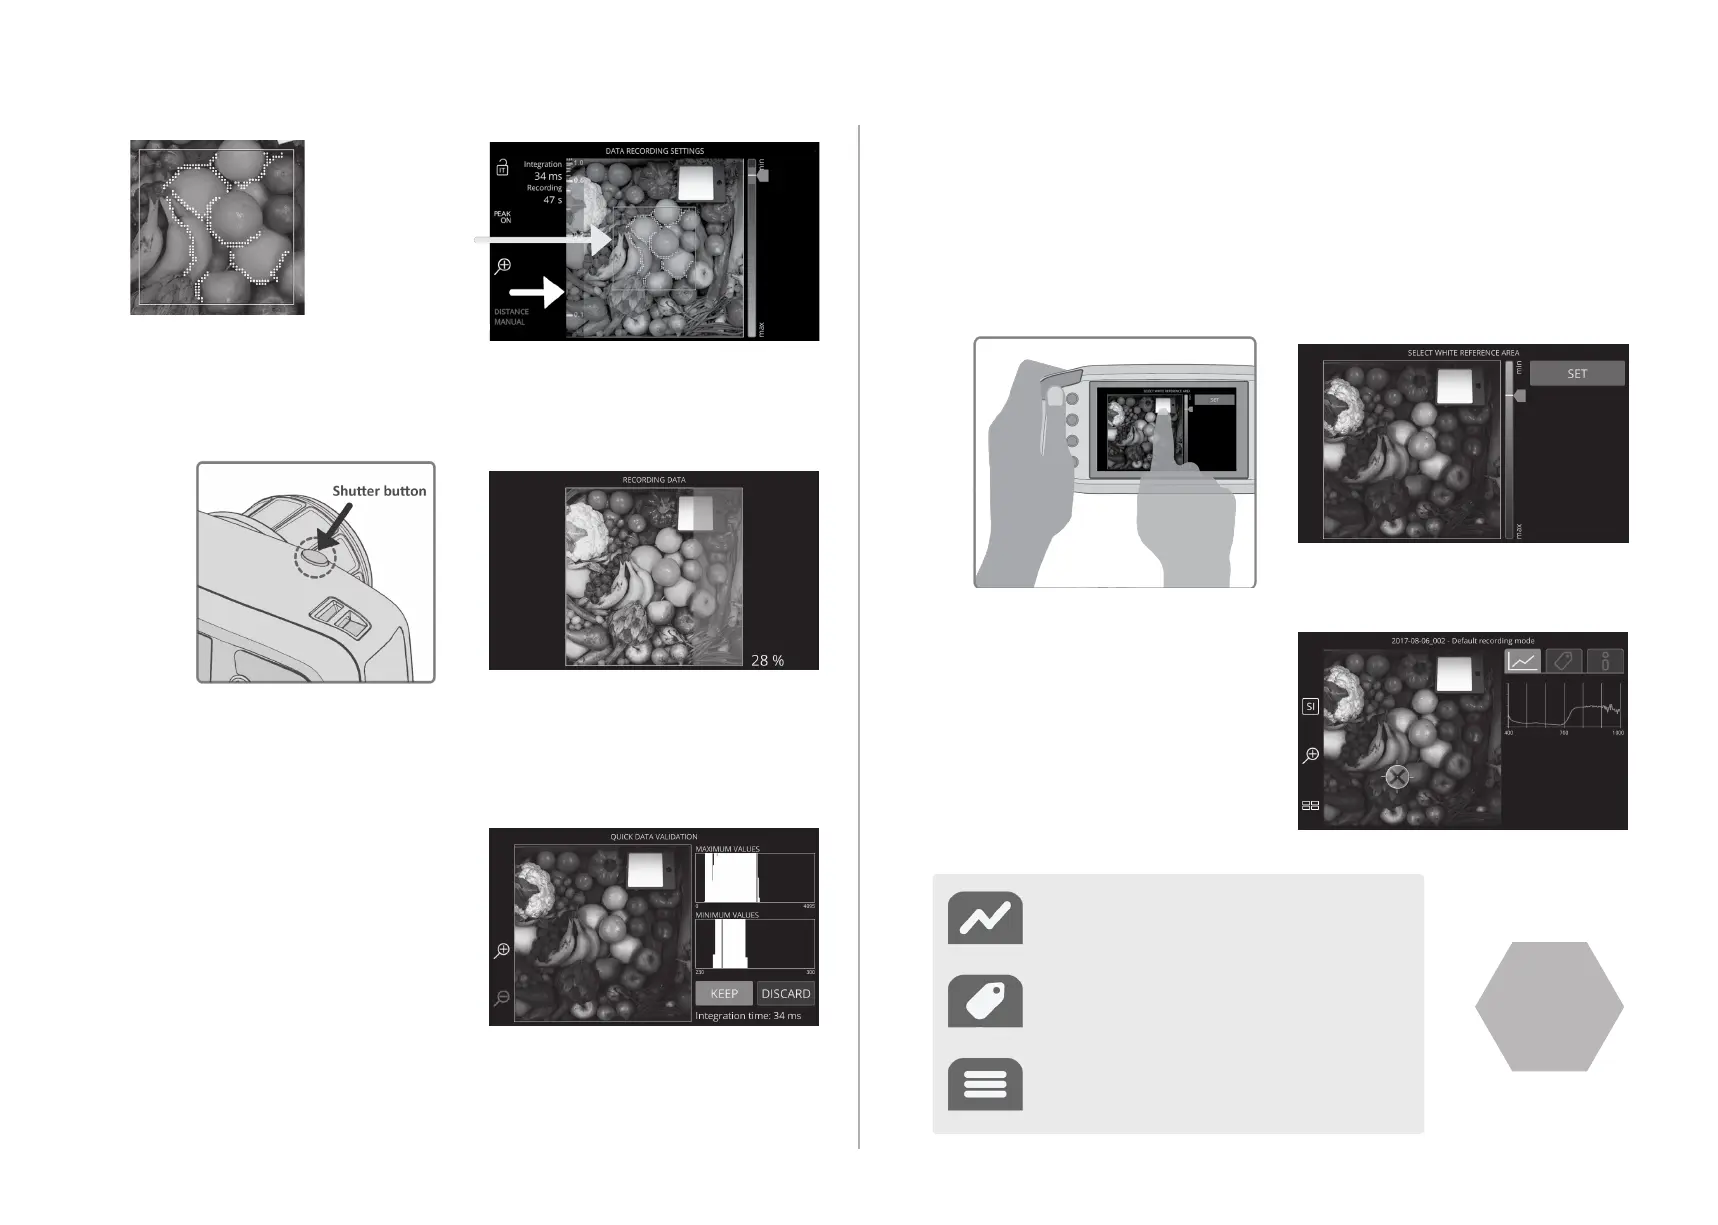
5. VALIDATE THE DATA
Validate and check the data quality
from the image preview and the
intensity histograms. If there are
red highlight areas in the image
preview and in the maximum
intensity histogram, the data is
partly saturated. In this case
consider changing the integraon
me shorter from the data record-
ing sengs and repeang the data
recording. If there are blue
highlights in the maximum intensity
histogram the integraon me
might be too short and some parts of the data are not illuminated properly.
In this case consider changing the integraon me longer. By pressing
DISCARD you can redo your DRS setup and record the data again. By
pressing KEEP, your data will be saved.
SEE THE
MANUAL
4. CAPTURE THE DATA
Fully press the shuer buon to record the data.
Target spectrum
By tapping a certain area, you can see
the spectrum of that pixel.
Tags
You can add tags to the data or to the
targeted pixels of the data.
Data info
See info about your data, delete datasets
and add addional text informaon.
6. WR SELECTION
Aer validang the data, dene the White Reference
from your data. Use the intesity slider on the right to
help select the correct WR area. Tap the WR on the
touch screen, or select it with the navigaon buons.
Choose SET on the screen when done.
7. THE RESULT VIEW
The result view has three funcons
that are located in the upright
corner.
NOTE: By pressing DISCARD,
your data will not be saved.
Focus
camera view
Enlargement of the
focus indicators
Spectral
camera view
 Loading...