3
3. Events
Events occurring in ATLAS trigger a recording and update of the following parameters:
water meter, battery level and signal.
The events are listed below:
1. Opening/Closing both manual and automatic.
2. Solenoid synchronization.
3. Communication test
4. State transition from “Sleep” to “Awake” and vice versa
5. Power mode settings
4. Water meter
ATLAS includes two outputs for the reading of pulse counters of different
manufacturers. The unit of measurement [m
3
ó L] or the value of each pulse [1, 10, 100]
can be defined in the platform. The current value of your counter can also be set in the
platform.
The counter registers usually update hourly
and after any event is triggered. These
values are shown as bar charts in the platform in the “Counter” section within the
selected date range. By default, data of the last three days is displayed.
Types of graphs
Total consumption
It is a bar chart that shows the total consumption [m
3
] of the associated counter.
Temporary consumption
It is a bar chart that shows the volumetric consumption [m
3
] produced within a couple
of consecutive records. For example:
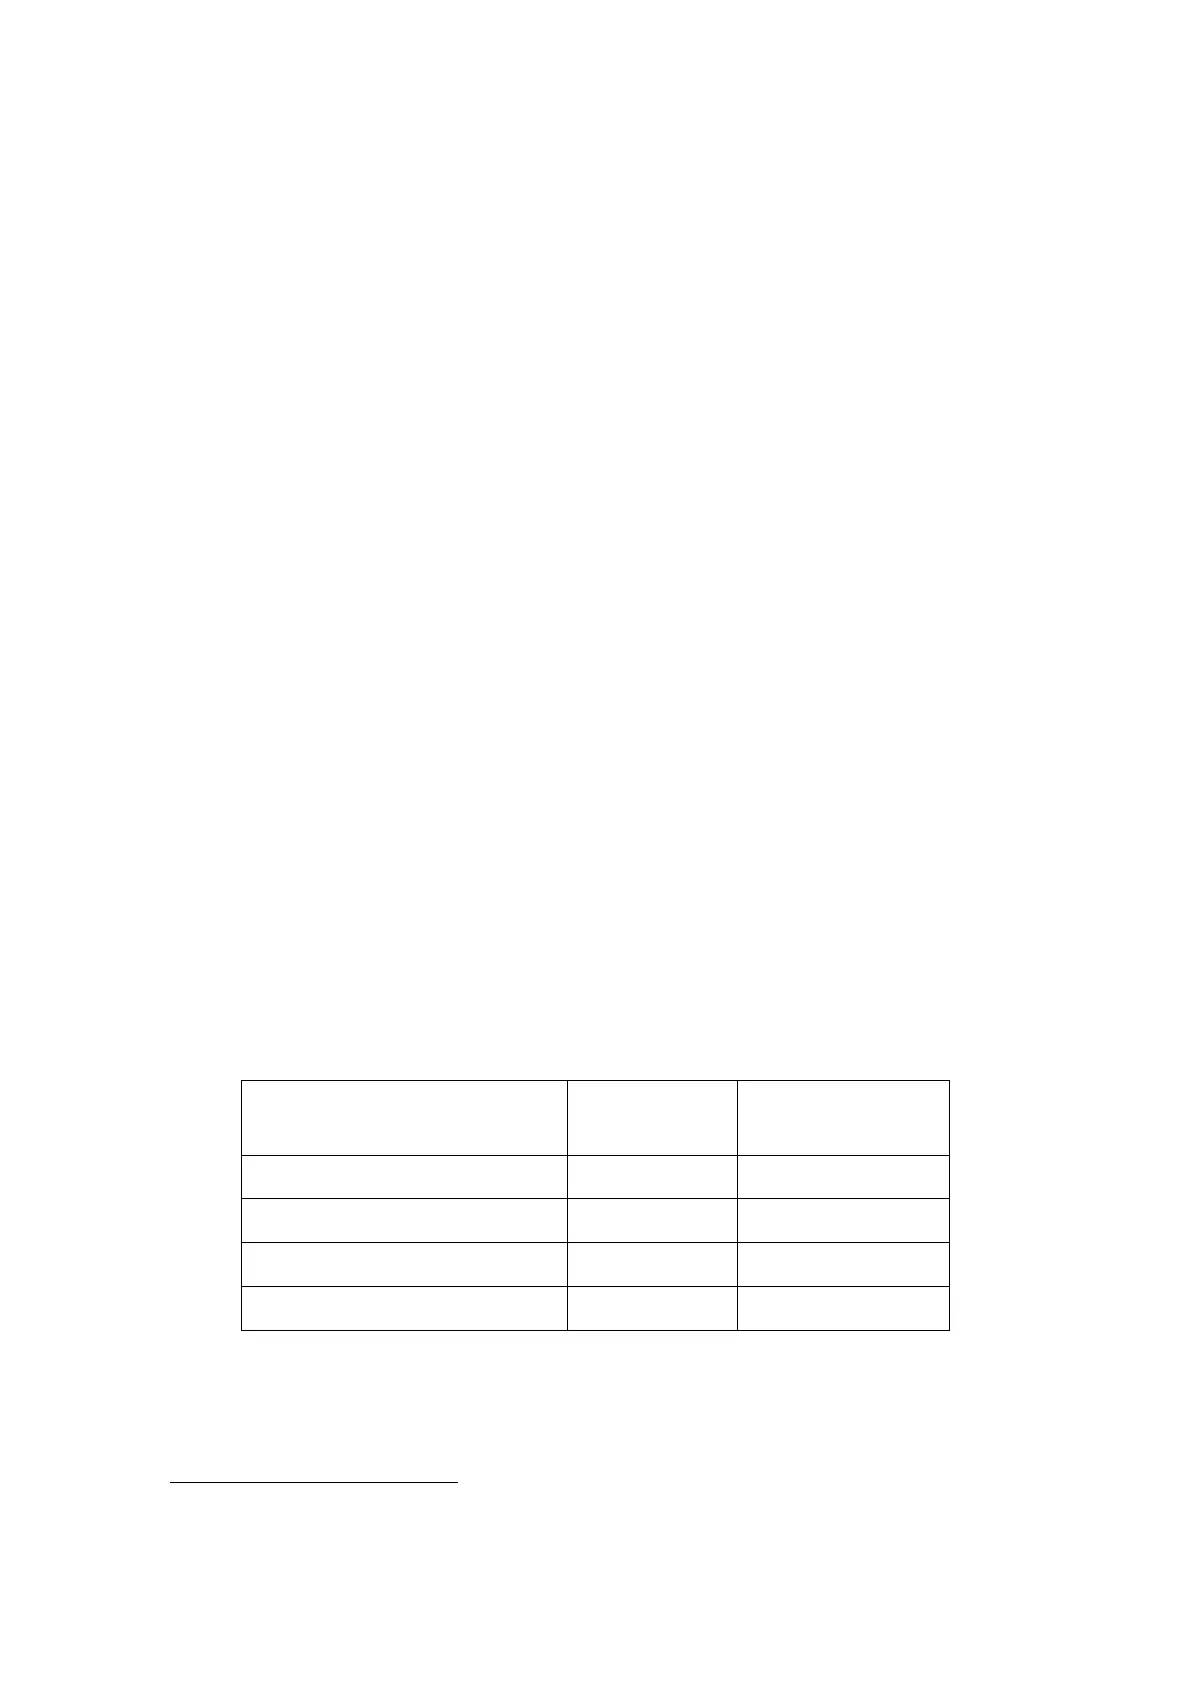
Monday, April 5th, 2021 10:30 am
Monday, April 5th, 2021 10:30 am
Monday, April 5th, 2021 10:30 am
Monday, April 5th, 2021 10:30 am
Also, a .csv and .xls file can be downloaded of both types of records in the date range
that you have selected.
it depends on the power mode and the associated state. See sections 5 and 6.
 Loading...