4-7
5. The display will be similar to the one shown below.
Displaying and adding one or more thermocouple(s) on the graph.
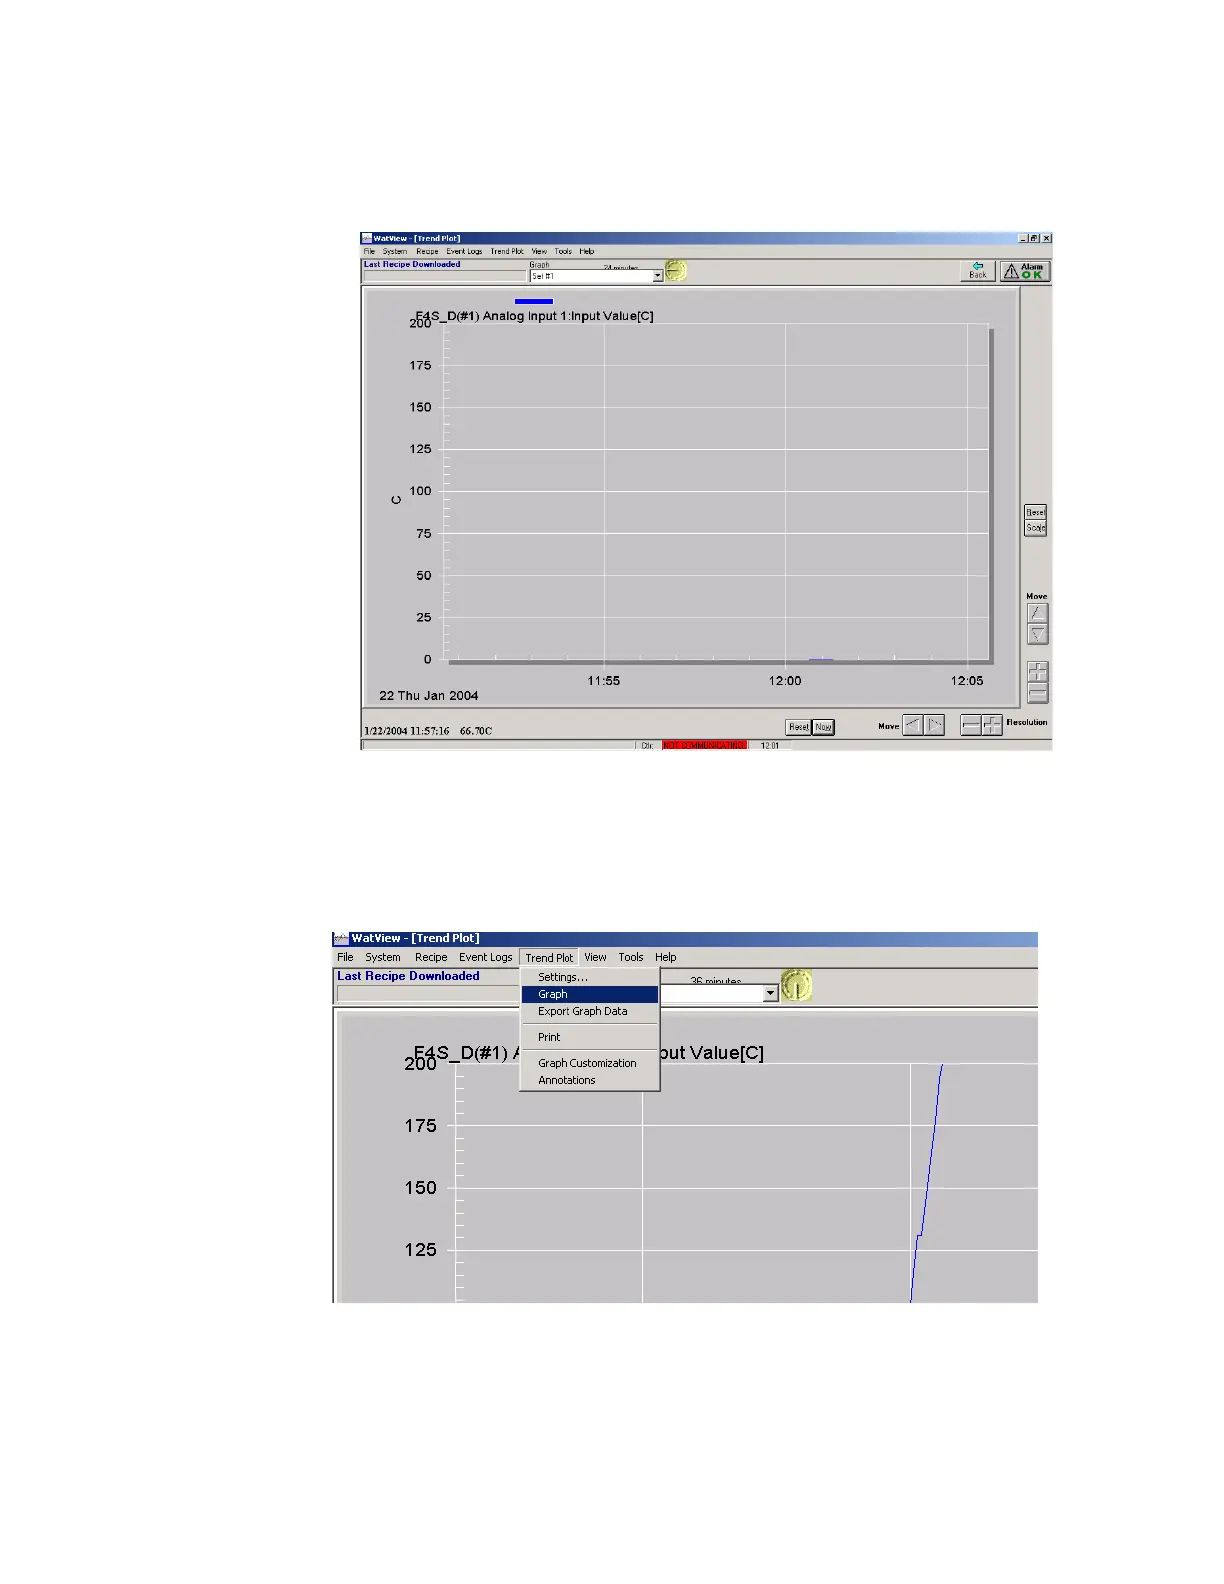
1. From Watview spreadsheets, choose “Trend Plot” from the menu bar,
then choose “Graph” from the dropdown menu as shown below.
2. The default display will not be the thermocouple readings as shown in the
controller. To choose control thermocouple to display in the graph, from
the graph menu bar, choose “Trendplot Settings” as shown below. If