OPERATION
Menu structure
www.stiebel-eltron.com WPF | WPF cool | 17
MIXER DYNAMICS
Mixer runtime
Setting range 60 to 240
You can use this setting to adapt the mixer characteristics. The
setting 60 to 240 means 6 K to 24 K control deviation.
The scan rate is 10 s and the minimum on time for the mixer is
0.5 s. The mixer does not respond in the dead zone of ±1 K from
the set value.
Example for the setting 100 = 10 K
The control deviation (set mixer temperature – actual mixer tem-
perature) is 5K. The mixer opens for 5 s, then pauses for 5 s and
starts again.
The control deviation (set mixer temperature – actual mixer tem-
perature) is 7.5 K. The mixer opens for 7.5 s, then pauses for 2.5
s and starts again.
The smaller the control deviation, the shorter the mixer on time
and the longer the pauses.
A reduction of the MIXER DYNAMIC value with the control devi-
ation unchanged increases the on duration and reduces pauses.
Example for setting 100 and a current control deviation of 5 K.
5 K of 10 K = 50% = on duration
Example: Control deviation
± 1 K
4
3
26�03�01�1067
1
2
1 Setting 100 = control deviation 10 K
2 Control deviation 5 K
3 Control deviation in K
4 On time in %
Heating curve rise
The menu item HEATING CURVE RISE enables you to adjust one
heating curve each for heating circuits1 and 2.
Note: Your contractor will have set a building and system-specific
optimum heating curve for every heating circuit. It relates to the
heat pump return temperature for heating circuit 1 and to the
mixer flow temperature for heating circuit 2.
When adjusting the heating curve on the heat pump manager, the
calculated set return or flow temperature, subject to the outside
temperature and the set room temperature, will be shown at the
top of the display.
As soon as you have preselected a temperature in menu SETTINGS
/ HEATING / STANDARD SETTING under parameter FIXED VALUE
OPERATION, heating curve 1 is hidden from view and the display
showsSETFIXED TEMPERATURE with the relevant temperature.
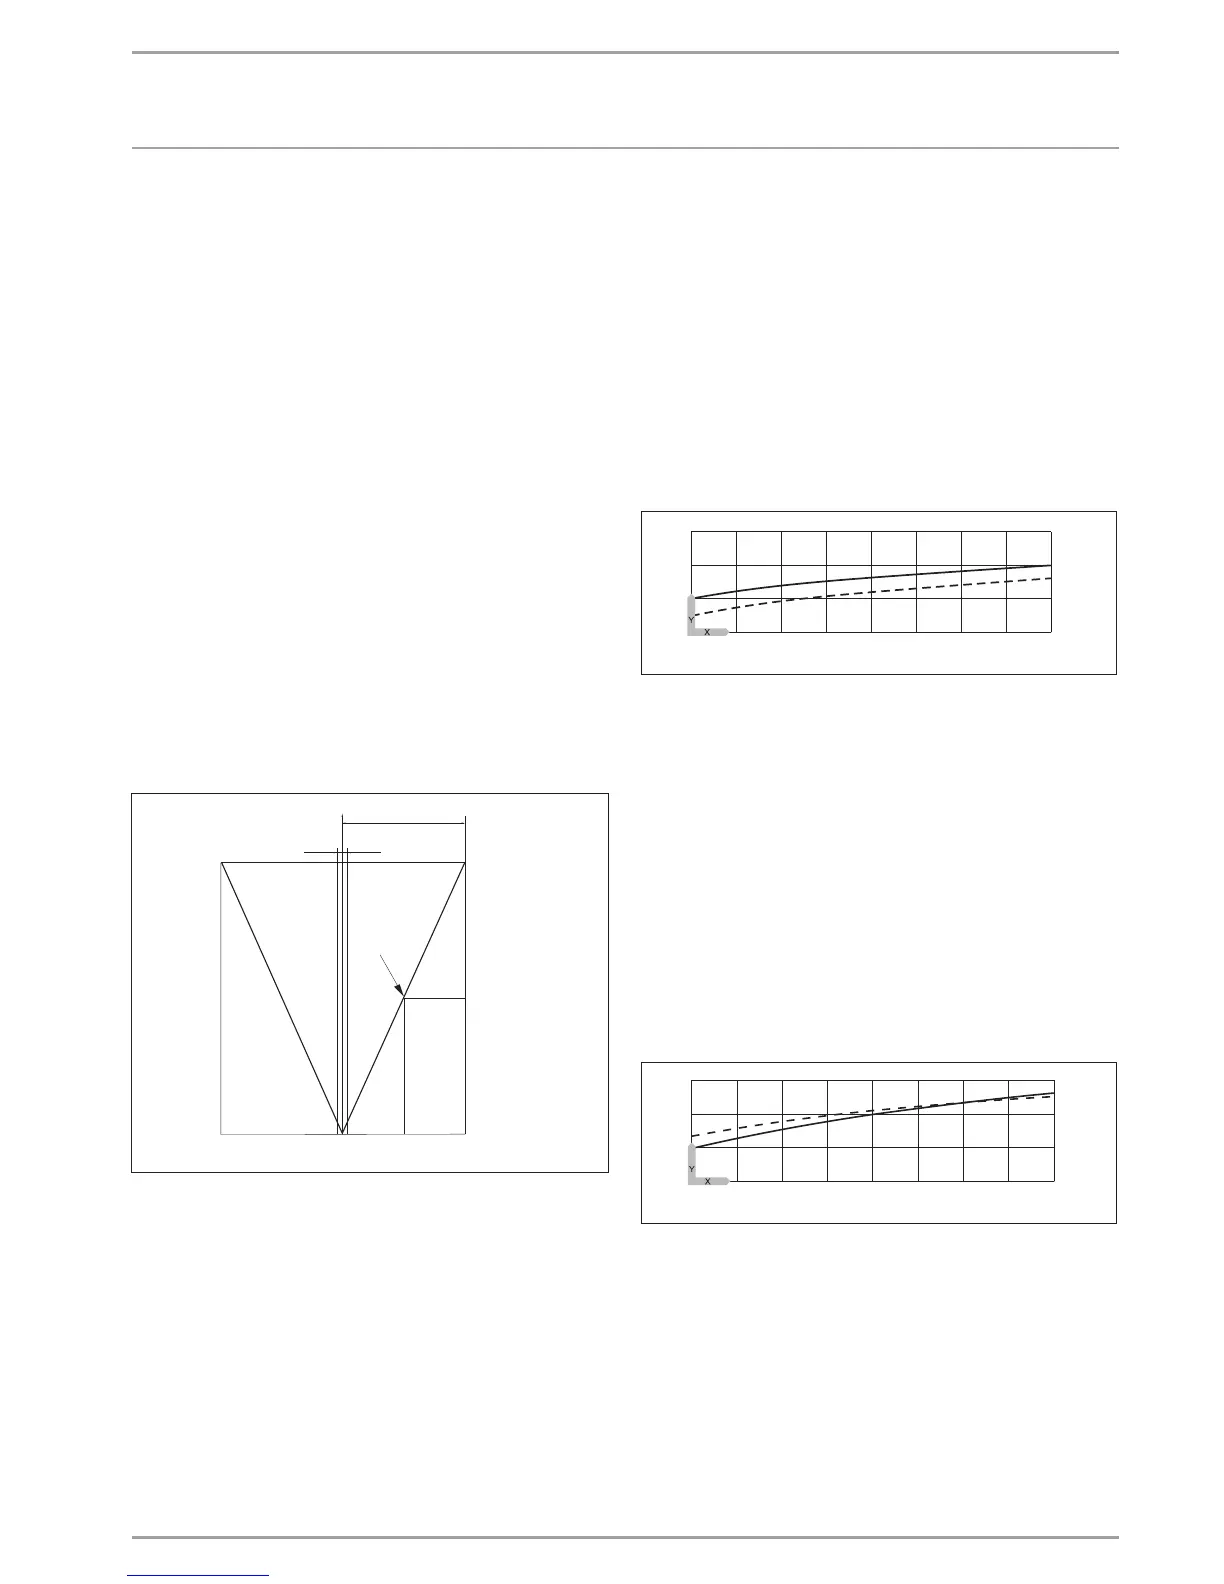
Heating curve
Adjustment of programmed changeover between Comfort and
ECO mode
The figure shows the diagram with the set heating curve relating
to a set room temperature for Comfort mode. The second, dashed
line in the display relates to a set room temperature for ECO mode.
60
40
20
0
1
2
20 15 10 5 0 -5 -10 -15 -20
26�03�01�1915
Y Return/flow temperature [°C]
X Outside temperature [°C]
1 Comfort mode
2 ECO mode
Adapting a heating curve
Example:
During spring and autumn, the temperature of a building's heating
system is too low at an outside temperature between 5 °C and
15°C, despite open radiator valves, but is OK at outside tempera-
tures of ≤ 0°C. This problem can be remedied with a parallel shift
and a simultaneous reduction of the heating curve.
Prior to this adjustment, heating curve 1.0 was adjusted, relative
to a set room temperature of 20 °C. The dotted line indicates the
modified heating curve at 0.83 and a modified set room temper-
ature of 23.2 °C.
60
40
20
0
20 15 10 5 0 -5 -10 -15 -20
26�03�01�1916+
Y Return/flow temperature [°C]
X Outside temperature [°C]
 Loading...