160.
A
140.
H
120.
E
100.
% 60
.
z
s
60.
-
R
40.
B
(Fig. 2)
LJ’
m
zoL~-..""..".."'
Sleep
12131415161716
192021 222324
1
2 3 4 5 6 7
69
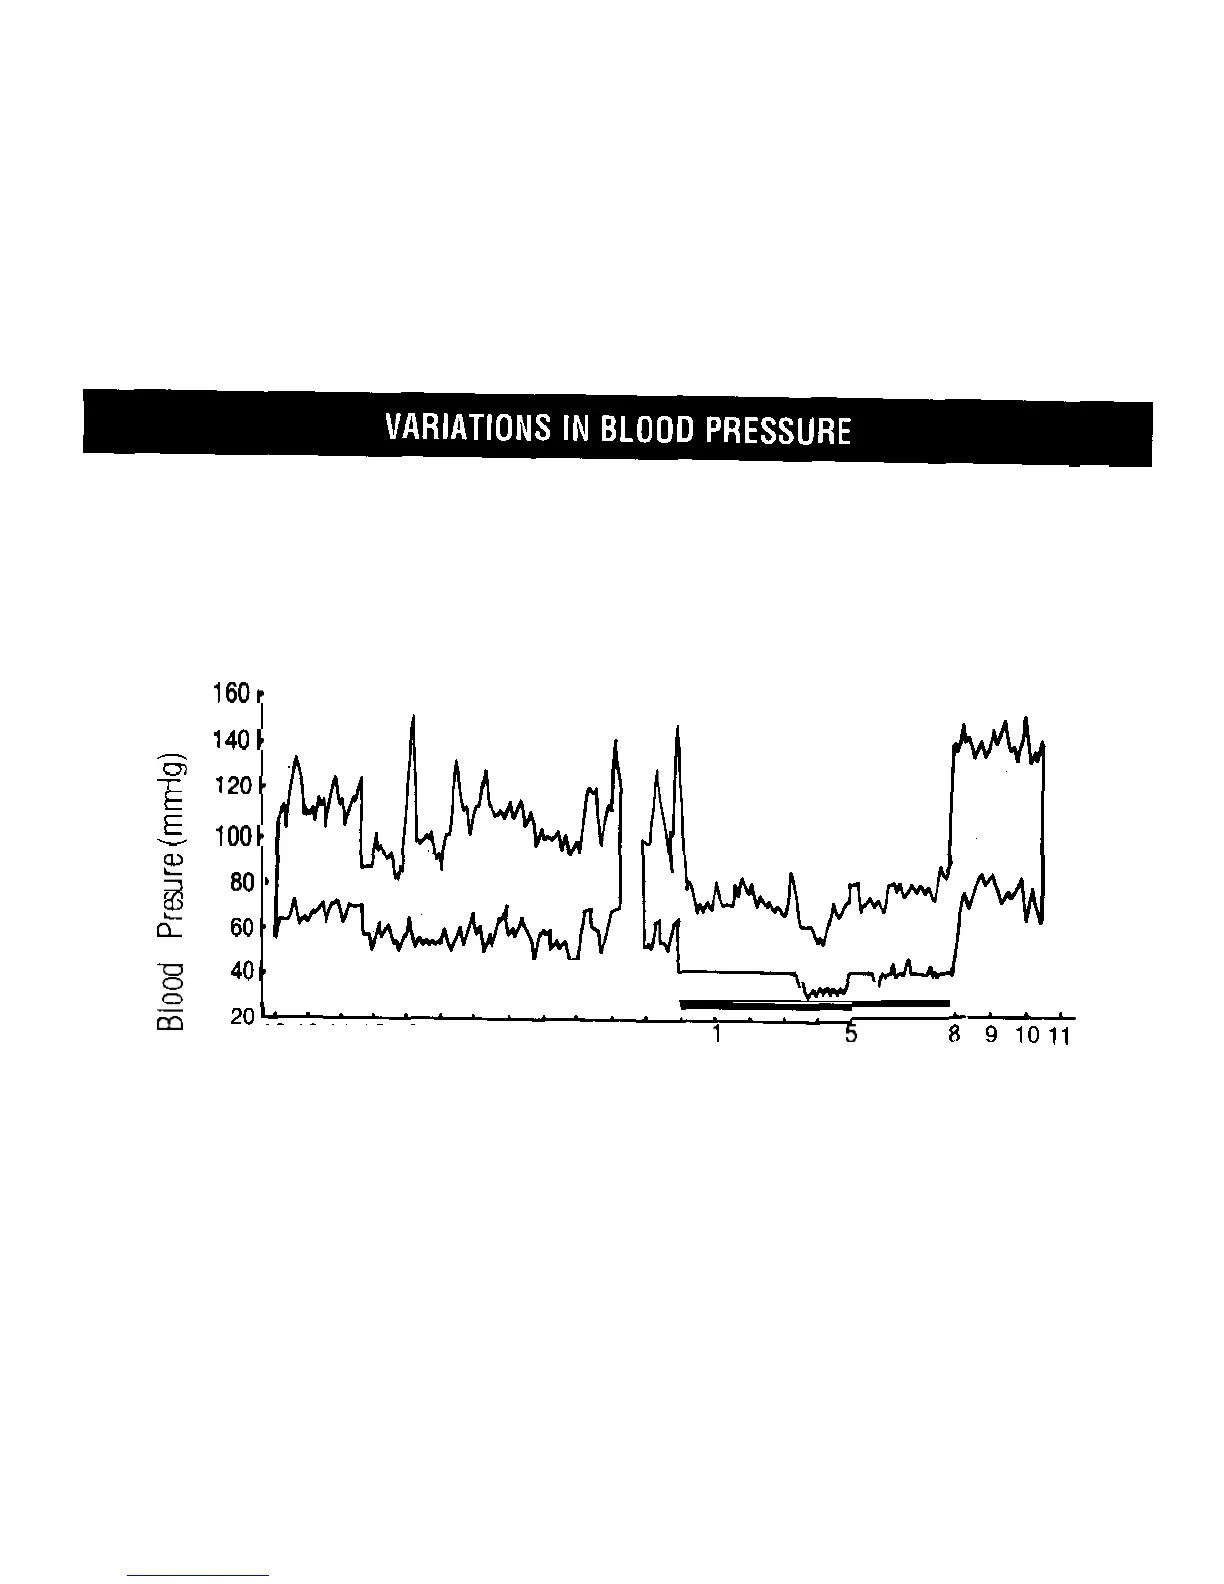
Individual blood pressures vary greatly both on a daily and a seasonal basis,
These variations are even more pronounced in hypertense patients. Normally the
blood pressure rises while at work and is at its lowest during the sleeping
period. The graph below illustrates the variations in blood pressure over a whole
day with measurement taken every five minutes.
PM Time AM
Shown is data tor measurements taken every 5 minutes. The thick line represents sleep
The rise in blood pressure at 4 PM (A in the graph) and 12 PM
(B
in the graph) corre-
spond to an attack of pain and sexual intercourse.
(Beven,
Honour
&
Stott: Clin. Sci.
36:329,
1969.)