FUNCTIONAL DESCRIPTION
Sysmex KX-21 Operator’s Manual -- Revised October 1998 9-11
6. ANALYSIS OF HISTOGRAM
Analysis of histogram allows use of the flagging system that suggests sample error or
instrument error.
Histograms of WBC, RBC, and PLT can be calculated respectively within the ranges given
below.
WBC: Approx. 30 - 300 fL (particle after lyse dripping)
RBC: Approx. 25 - 250 fL
PLT: Approx. 2 - 30 fL
6.1 Analysis of WBC Histogram
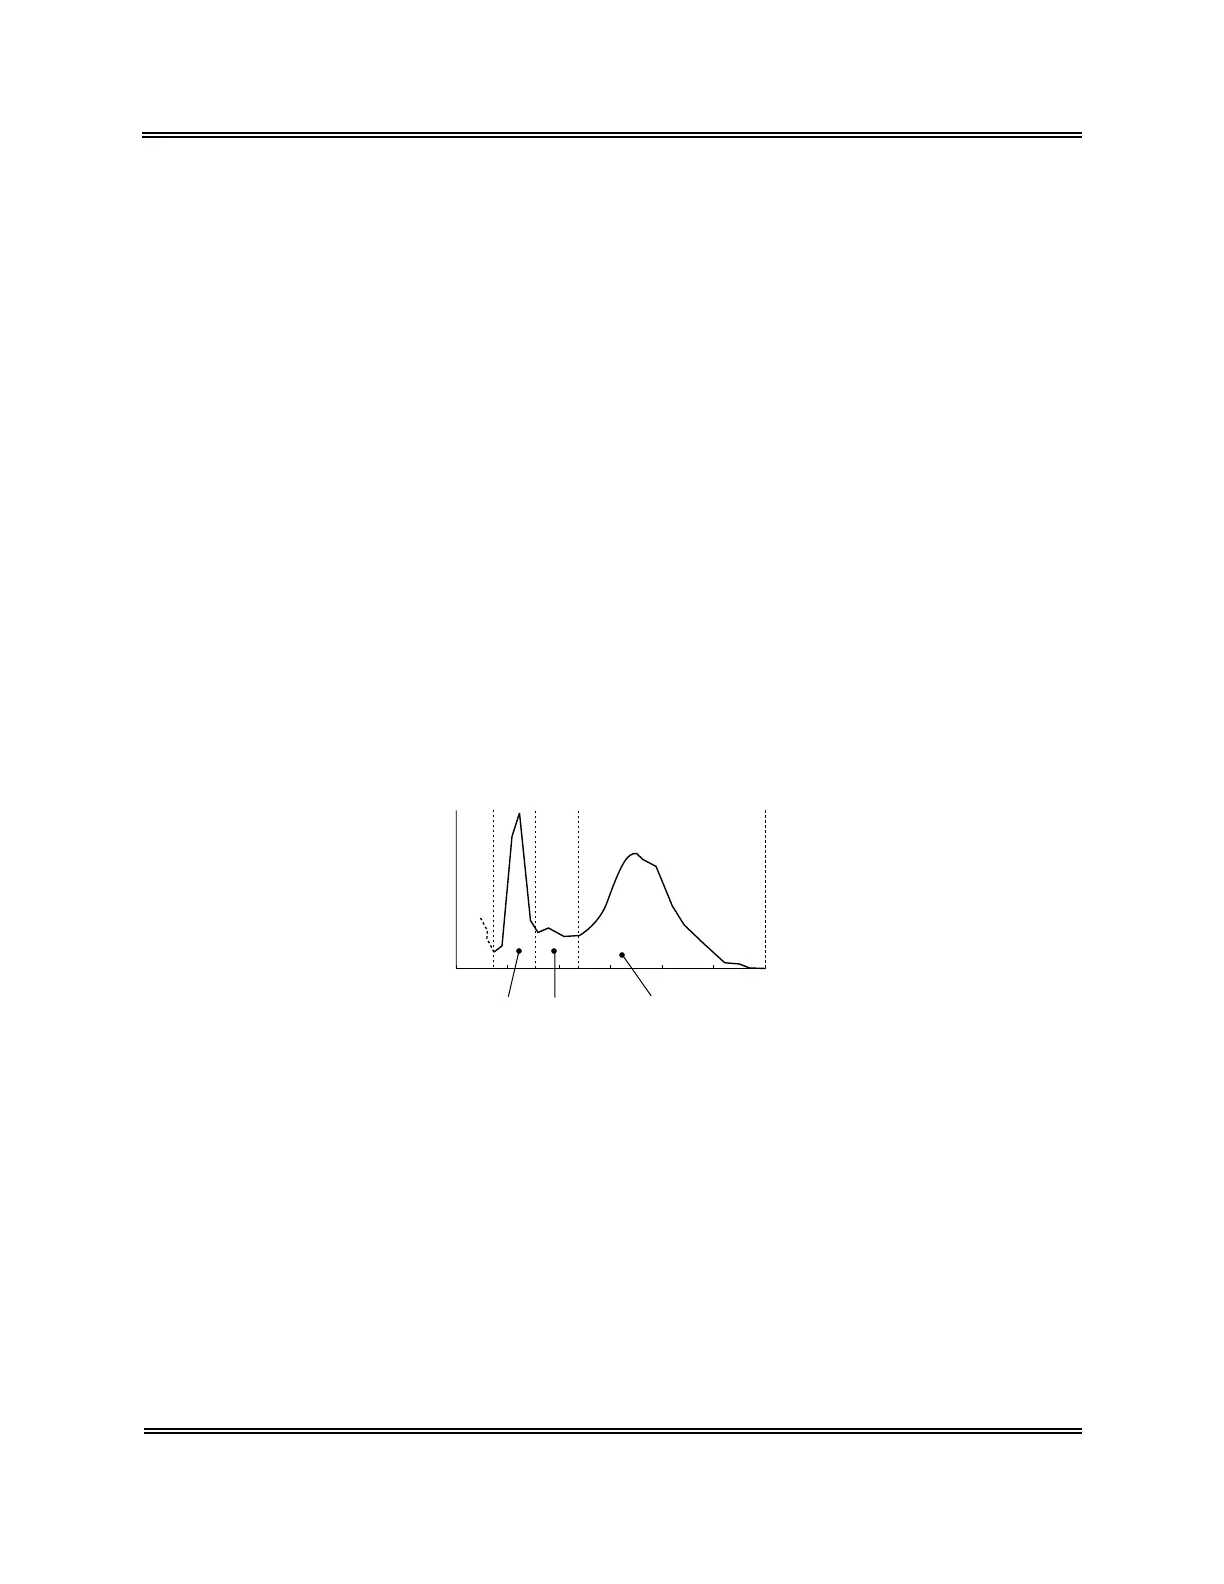
1. WBC Histogram
The WBC histogram is discriminated into small, middle, and large WBC by 3-part
differential method using 4 discriminators. The LOWER discriminator (LD) is
automatically determined at an optimum position between 30 and 60 fL. The UPPER
discriminator (UD) is fixed at 300 fL, which is used as the monitor for histogram
error. The WBC histogram troughs in the (LD)-to-(UD) range are determined; the 1st
one is defined TROUGH Discriminator 1 (T1) and the 2nd one TROUGH
Discriminator 2 (T2).
• WBC Histogram
300
WBC
UD
Lymphocytes
Mixed cells
Neutrophils
200100
LD T1 T2
[fL]
Figure 9-6-1: WBC Histogram
1) LYM# [W-SCC (WBC-Small Cell Count) ]
Lymphocytes between discriminator (LD) and (T1), which is considered highly
correlated with lymphocyte count.
2) MXD# [W-MCC (WBC-Middle Cell Count) ]
Mixed cells between discriminator (T1) and (T2), which is considered highly
correlated with the sum of monocytes, basophils, and eosinophils.
3) NEUT# [W-LCC (WBC-Large Cell Count)]
Neutrophils more than discriminator (T2), which is considered highly correlated
with neutrophils.
 Loading...