Page 7
www.theenergydetective.com
Page 7
v.3.3.1
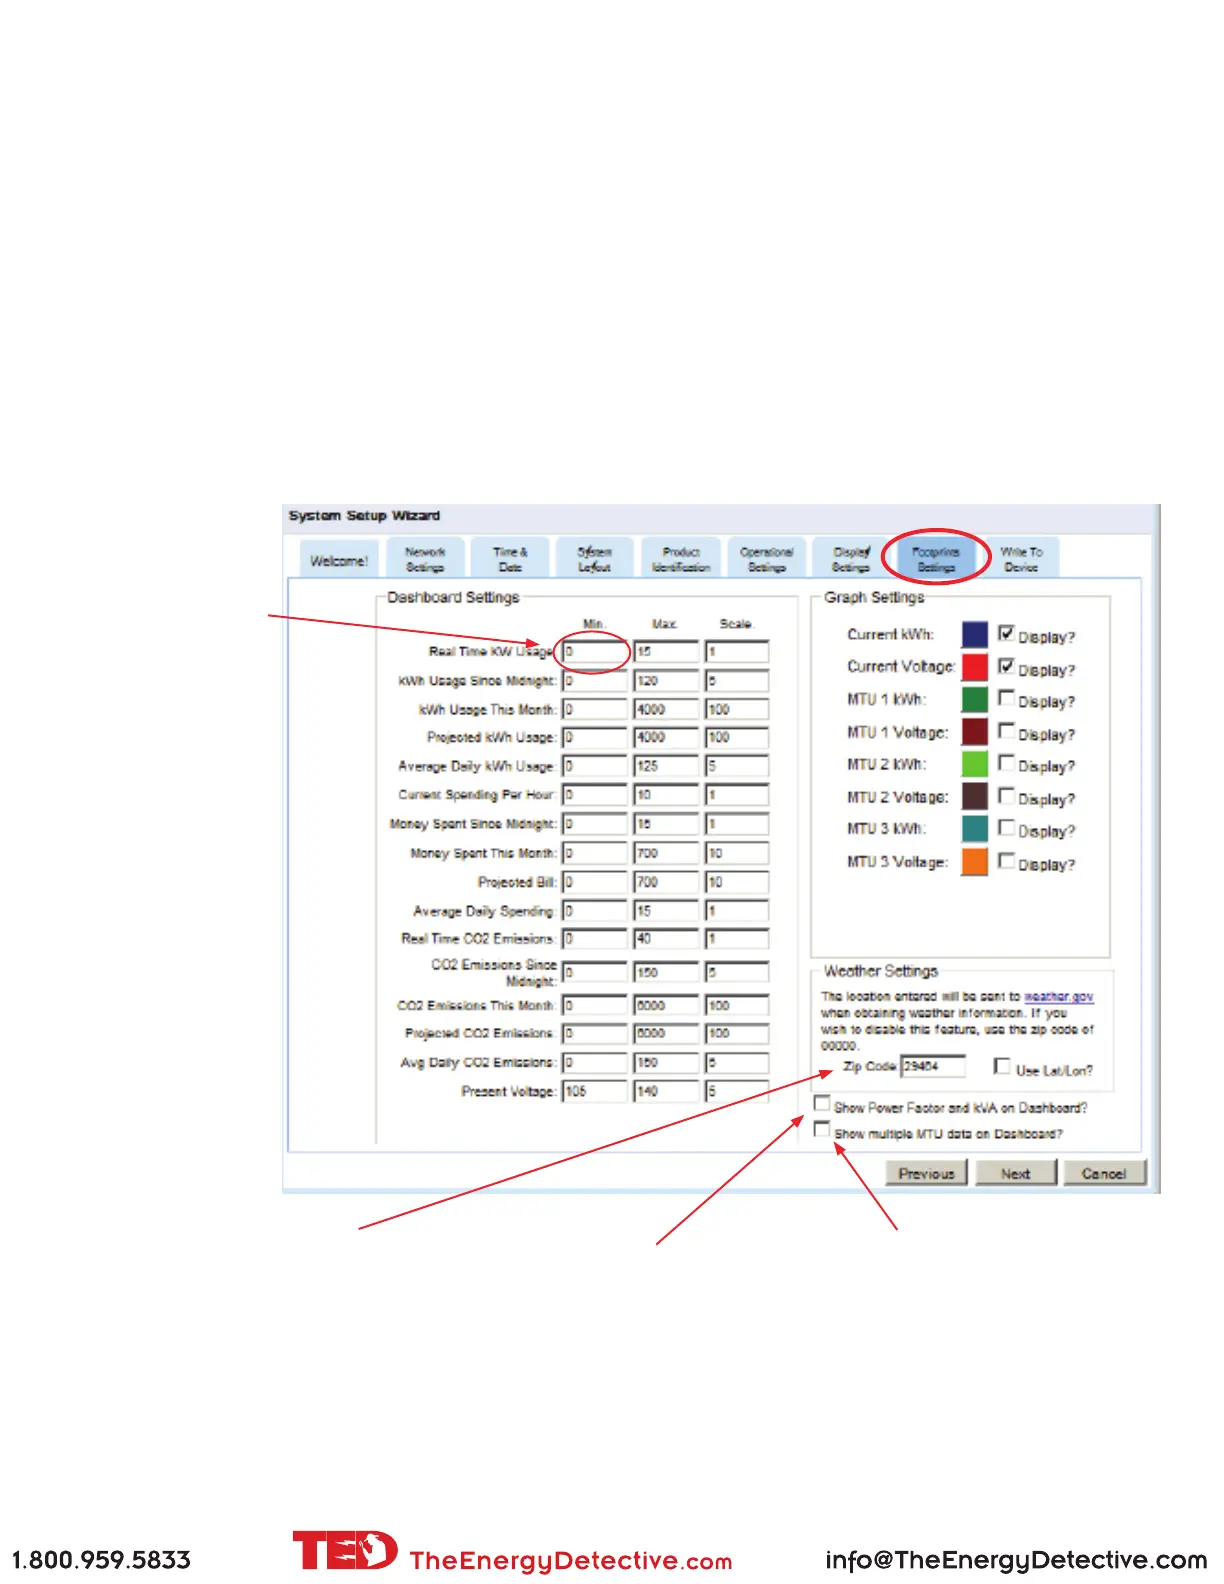
Footprints Settings
You can adjust the ranges displayed within the Footprints program.
Dashboard Settings:
The Max Value is the maximum amount shown on any graphs. If you have a small, energy-efcient home and fam-
ily, you may only see a maximum real time use of 5kW. Change the “Real Time kW Usage” setting to “5” and the
maximum on the dial will be 5kW instead of 12kW. If you have a large home, you may need to change it to 40kW
to keep the needle from pegging. Any of the scales can be changed temporarily from the Dashboard by pressing
the + - tabs. The Scale Value adjusts how much the scale changes with each press of the + - key. This will help you
determine what the permanent settings should be in Footprints Settings.
Graph Settings:
You can adjust which items will be graphed and in which color. To show Multiple MTUs you can choose to
show all the values or just the total.
Input your Zip Code for
weather display. Weather
is updated every hour. For
installations outside of the
continental US, you may
input your latitude/longitude
for weather.
For Solar installations
only, make this number
a NEGATIVE number
equal to the size of
your PV system. In
other words, if you
have a 7kW system,
you should make this
a -7.
Check this box to
see multiple MTUs
on the Dashboard
Check this box to show
Power Factor and kVA
on Dashboard. (If you’re
not sure what these are,
don’t bother checking
the box...it’s for the
electrical-guys.)