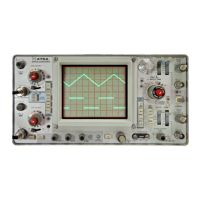
Fig. 6-42. Typical equipment setup to check response flatness, sensitivity, frequency calibration and phase lock operation for band C.
A secondary or alternate source of accurate fre-
quency markers is the combination of two calibra-
tion fixtures (Harmonic Generator 067-0594-00
and a 200 MHz Trap 067-0595-00) and a rela-
tively low frequency, accurate (at least 0.1%)
signal source such as a Time-Mark Generator (Type
184).
The harmonic generator will produce sufficient
harmonic signal power, from the Type 184, to pro-
duce frequency markers into the GHz range. The
200 MHz trap attenuates the IF feedthrough spuri-
ous response.
This procedure is divided into two steps, with step
38B describing the dial check procedure using the
harmonic generator.
a. Equipment setups are shown in Fig. 6-41 through 6-43.
Fig. 6-45 shows the setup for the alternate procedure to check
dial accuracy (step 38 B),
b. Apply a frequency and amplitude calibrated signal,
between -60 dBm and -30 dBm, to the appropriate RF
INPUT connector. Switch the Type 491 band selector switch
to the appropriate band.
c. Set the DISPERSION to 500 kHz/div and the RESOLU-
TION control for a resolution bandwidth of 100 kHz (fully
clockwise).
d. Adjust the GAIN control for an average noise ampli-
tude of one division. Center the IF CENTER FREQ and FINE
RF CENTER FREQ controls.
e. Tune the signal on screen with the RF CENTER FRE-
QUENCY control. Reduce the signal amplitude with the
signal generator output attenuator control for an on-screen
display, then adjust the MIXER PEAKING control and sweep
rate for optimum signal amplitude. (Sweep rate 5 ms/div
or slower.)
f. Calibrate the signal generator output, then adjust the
variable output attenuator control on the signal generator
until the signal amplitude is two divisions (twice the noise
amplitude). See Fig. 6-44.
g. Check the total signal attenuation (in dB) below 0 dBm
as indicated on the signal generator attenuator dial. This
is the sensitivity of the analyzer for the RF center frequency
indicated. Check as listed in Table 6-9 under 100 kHz re-
solution. Sensitivity can also be checked for 1 kHz resolu-
tion, however, a very stable signal source is required at the
higher frequencies. Sweep speed must be rduced to 50 ms/
div or slower to check sensitivity at 1 kHz resolution.
6-41