The following are basic applications for the Type 491
and are presented to illustrate some of these uses in the
electronics field.
Relative Amplitude Measurements
The relative amplitudes of signals are measured as follows:
1. Center the IF CENTER FREQ controls. Switch out any
IF ATEN. Tune the signal with the lowest amplitude to the
center of the screen.
2. Adjust the GAIN control so the low amplitude signals
establish a reference amplitude.
3. Tune the stronger signal to the center of the display.
Add IF attenuation by switching combinations of IF AT-
TENUATION until the stronger signal amplitude decreases
to the same reference amplitude established in step 2.
4. Add the total attenuation that was switched in. This
is the relative amplitude difference, in dB, between the two
compared signals.
NOTE
For maximum accuracy, the signals should be ref-
erenced and compared near the same location on
the display. Tune each signal to the reference
location with the RF CENTER FREQUENCY control.
The IF CENTER FREQ, the DISPERSION-COUPLED
RESOLUTION, the FINE RF CENTER FREQ, and the
TIME/DIV controls should not be changed when
measuring relative signal amplitude.
The peak amplitude of the main lobe of a pulse modulated
RF spectrum represents only a portion of the total energy
contained in the lobe. The main lobe is less than the ampli-
tude of an equal peak value CW signal, by an amount
which is approximately 3/2†B; where t is the measured
pulse width in seconds, and B is the selected resolution
bandwidth of the analyzer in hertz. Spectrum Analyzer
sensitivity measurements should therefore be made with a
CW signal.
Frequency Measurements
Frequency measurements taken from the RF CENTER FRE-
QUENCY dial are accurate to within ± (2 MHz +1% of the
dial reading). The frequency of an applied signal is measured
as follows:
1. Check the calibration of the IF CENTER FREQ CAL
adjustment as described under Front Panel adjustments.
2. Set both IF CENTER FREQ controls and the FINE RF
CENTER FREQ control to their midrange (000) position.
3. Set the DISPERSION RANGE switch to kHz/DIV and the
DISPERSION selector to 500 kHz/div.
4. Tune the RF CENTER FREQUENCY so the signal to be
measured is in the graticule center.
5. Read the frequency indicated on the RF CENTER FRE-
QUENCY dial. The signal frequency is the dial reading
± (2 MHz +1% of the dial reading). For example: A dial
reading of 1000 MHz indicates the signal is 1000 MHz
± (2 MHz + 10 MHz) or, between 988 MHz and 1012 MHz
Accurate frequency measurements can be performed by
applying a calibrated or crystal-controlled frequency to the
RF INPUT and calibrating the dial near the frequency range
of the input signal; then tune the input signal to the same
screen position and note the dial reading plus or minus the
measured dial accuracy.
Frequency Difference Measurements
Frequency separation measurements to 100 MHz can be
made between signals as follows:
1. Switch the DISPERSION RANGE switch and the DIS-
PERSION selector so the signals to be measured are the maxi-
mum number of graticule divisions apart on the display.
2. Set the TIME/DIV selector and the RESOLUTION control
for optimum signal definition. [Sharp and clean signal dis-
play.)
3. Measure the distance, in graticule divisions, between
the two signals (see Fig. 2-23.)
4. Multiply the measured distance in step 3 by the Disper-
sion/Div setting. This is the frequency separation or frequency
difference between the two signals.
NOTE
Accuracy of this measurement depends on the DIS-
PERSION RANGE settings.
See Characteristics
Section.
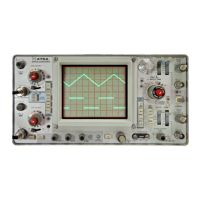
Fig. 2-24. Short term stability measurement. Random FM charac-
teristic of a klystron.
DISPERSION is 2 kHz/Div and RESOLUTION
is 1 kHz. Oscillator FM is about 6 kHz.
2-21
 Loading...