Operating Instructions
2–8
760A / 760D / 760N
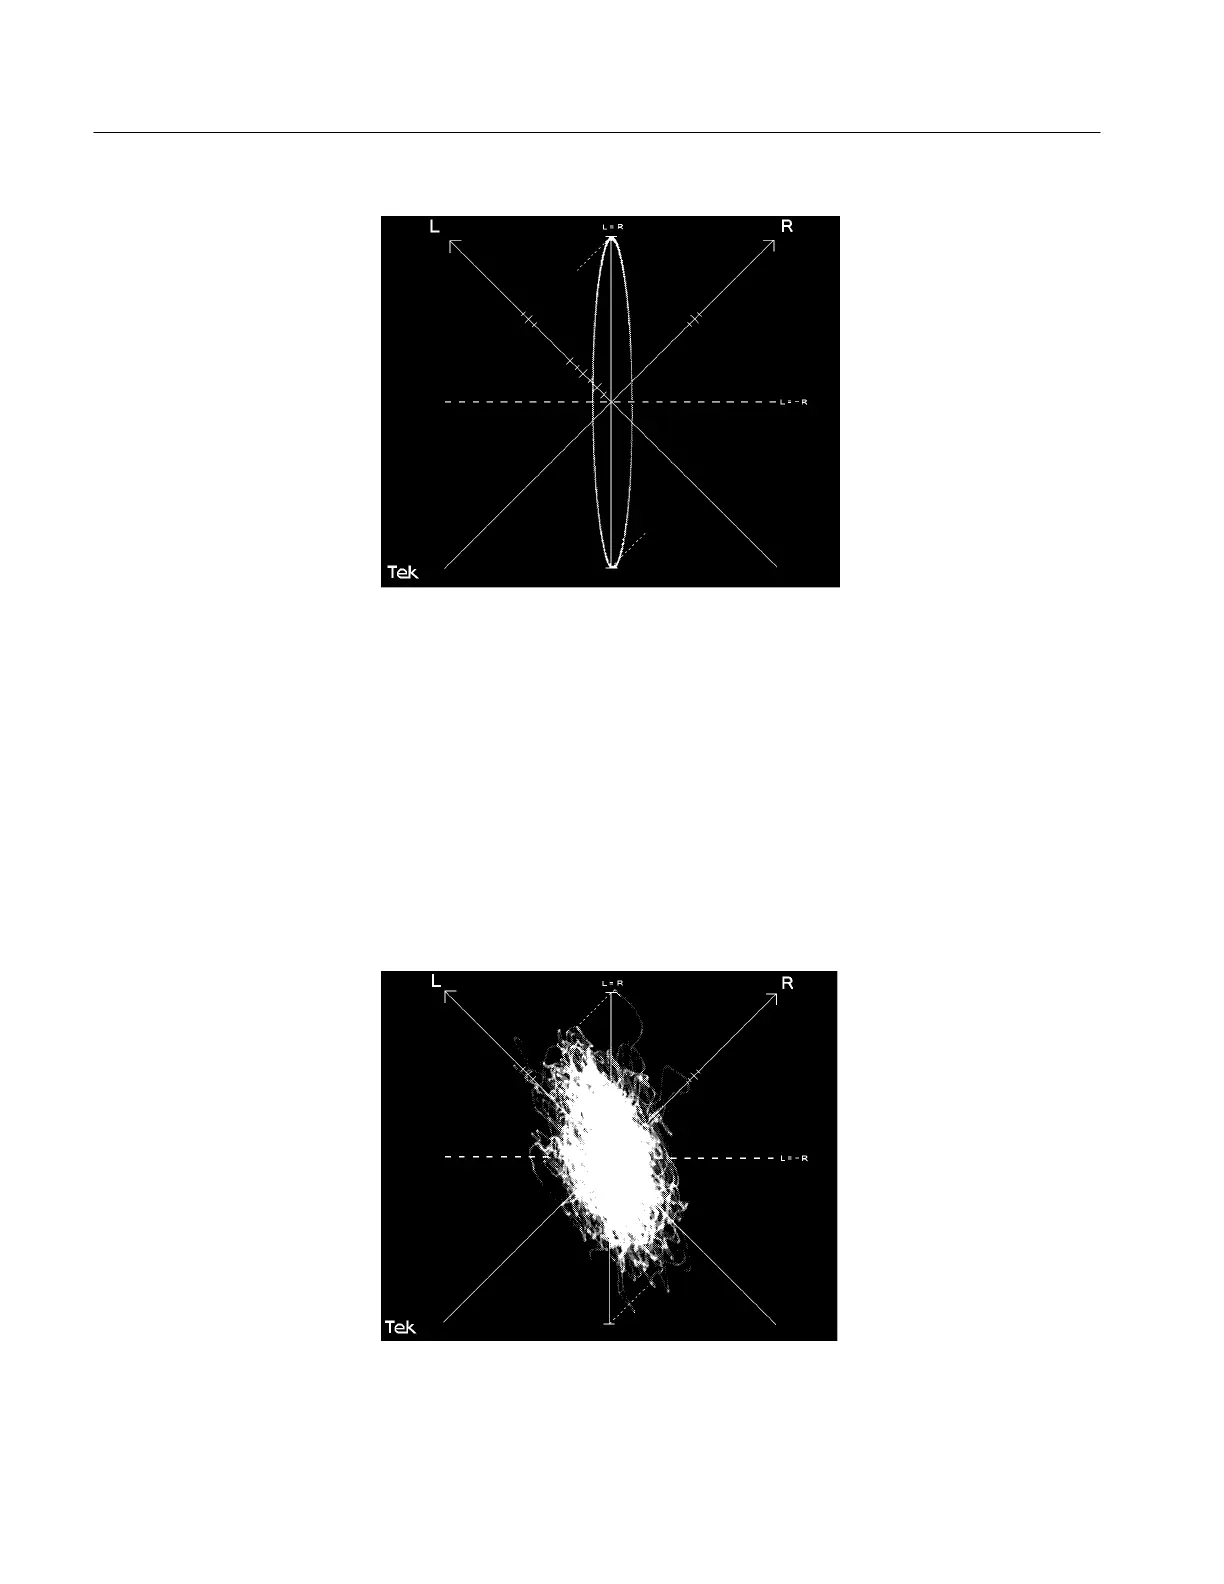
Figure 2–5: Ellipse with approximately 13° phase error
If the ellipse closes to a single line, the LEFT and RIGHT channels are in phase
as long as the line is within 45° of the L=R axis. The line may tilt if the
amplitudes are unequal. A line within 45° of the L=–R axis indicates the
channels are out of phase.
The 760A’s pattern display provides a graphic representation of the stereo
signal’s overall energy distribution. The pattern orientation tells you at a glance
whether the present mix is balanced or concentrated to either side. Figures 2–6
and 2–7 illustrate different energy distributions.
Figure 2–6: Strong left content
Energy Distribution