A07A2200S
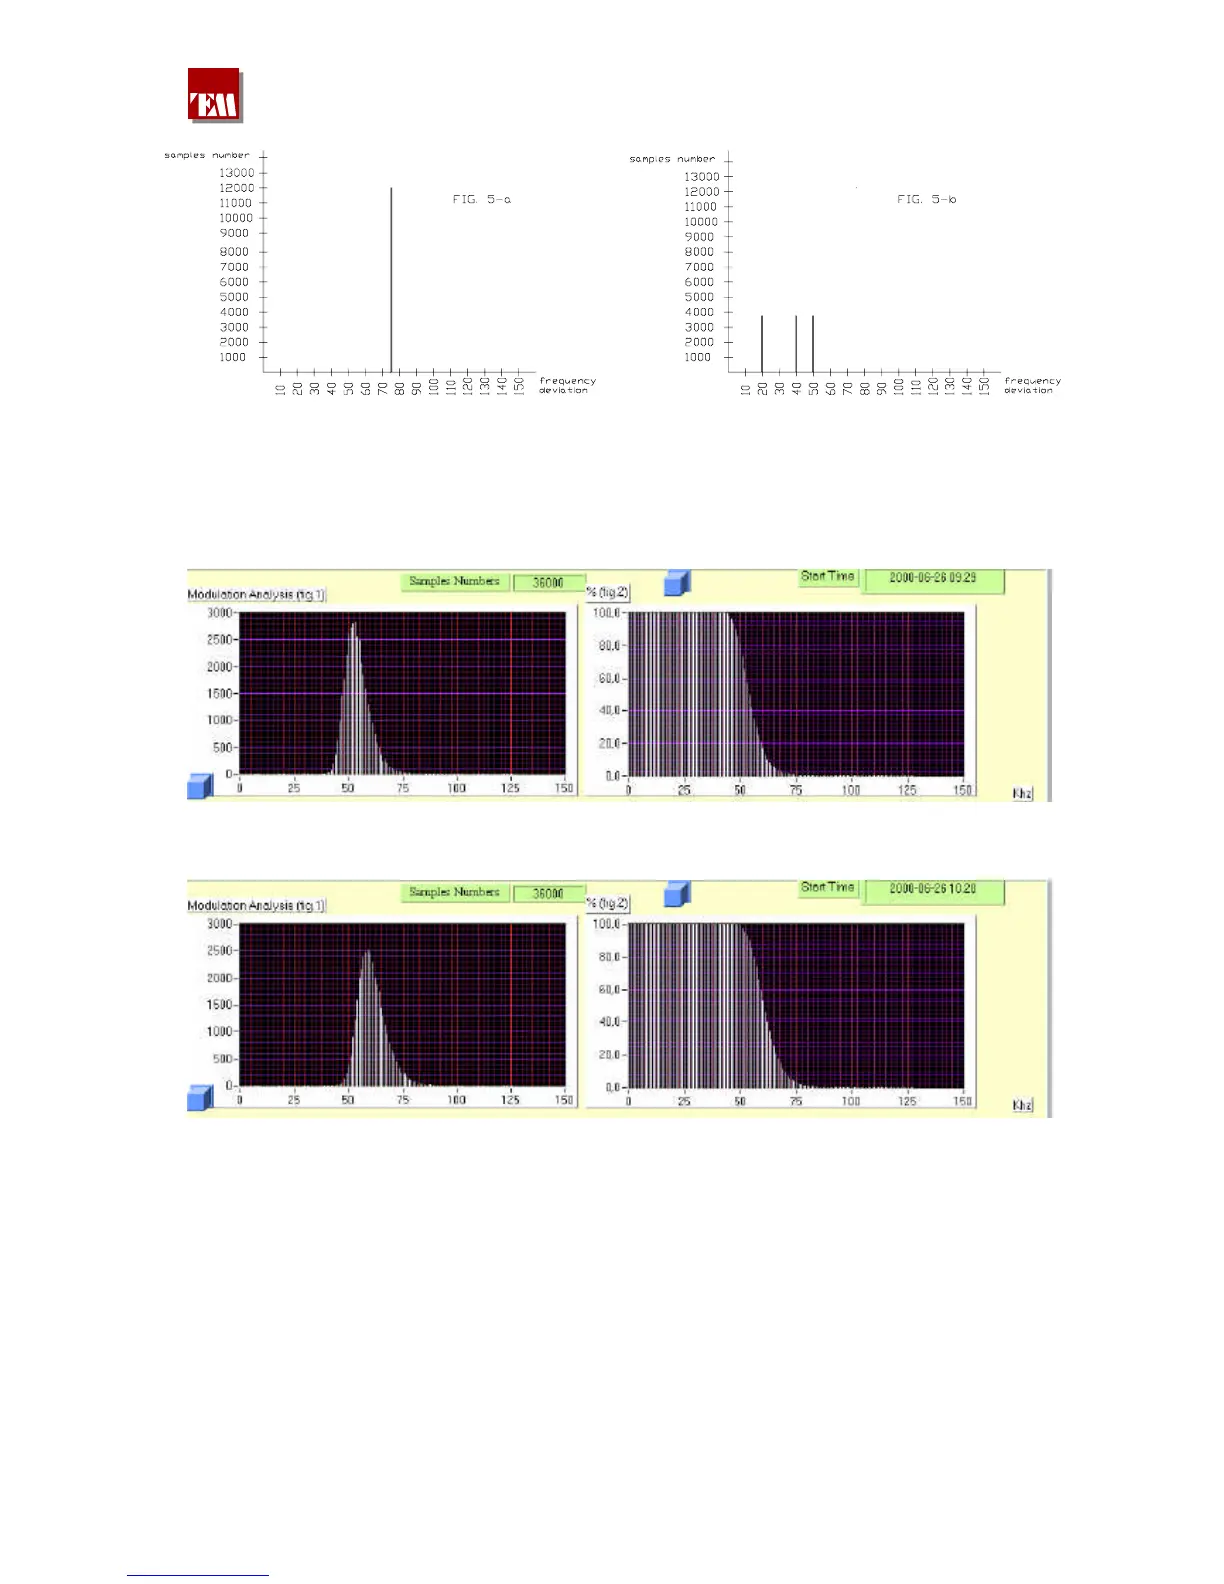
Now, instead of these simple examples, take our transmitter modulated with the sample noise
previously mentioned, and we detect in accordance with the CEPT 54-01 the modulation peak
samples in a 30 minutes observation period, so obtaining the graph. 5.c-a whereas, if we increase
the modulation, always with the same input signal, of 1dB, we’ll obtain the graph 5.d-a with a 30
minutes observation period:
fig. 5.c-a fig. 5.c-b
fig. 5.d-a fig. 5.d-b
On the first graph it can be observed that during the 30 minutes about 2600 peak samples have been
measured which have deviated the carrier of ±54KHz, 1500 ±60KHz, 10 ±75KHz, while about ten
samples resulted higher than ±75KHz. What has been measured is a signal which respects all the
spectrum occupation and over modulation rules; it can be soon noticed that this signal has been
higher with its modulation peaks than the threshold of 75KHz for about 0.2% of the samples so it’s
wrong to sustain that this value is never exceeded at all. Relying for the modulation adjustment on
the bar-graph of which almost all the transmitters are equipped, one risks to have to under modulate
if the trimmer is set to remain within 75KHz.
380 221 R02 Pag. 37