A07A2200S
DT 100 FM Broadcasting Transmitter
As appendix the whole theory concerning this kind of measurements is dealt in chapter 7, dedicated
to the modulation measurements.
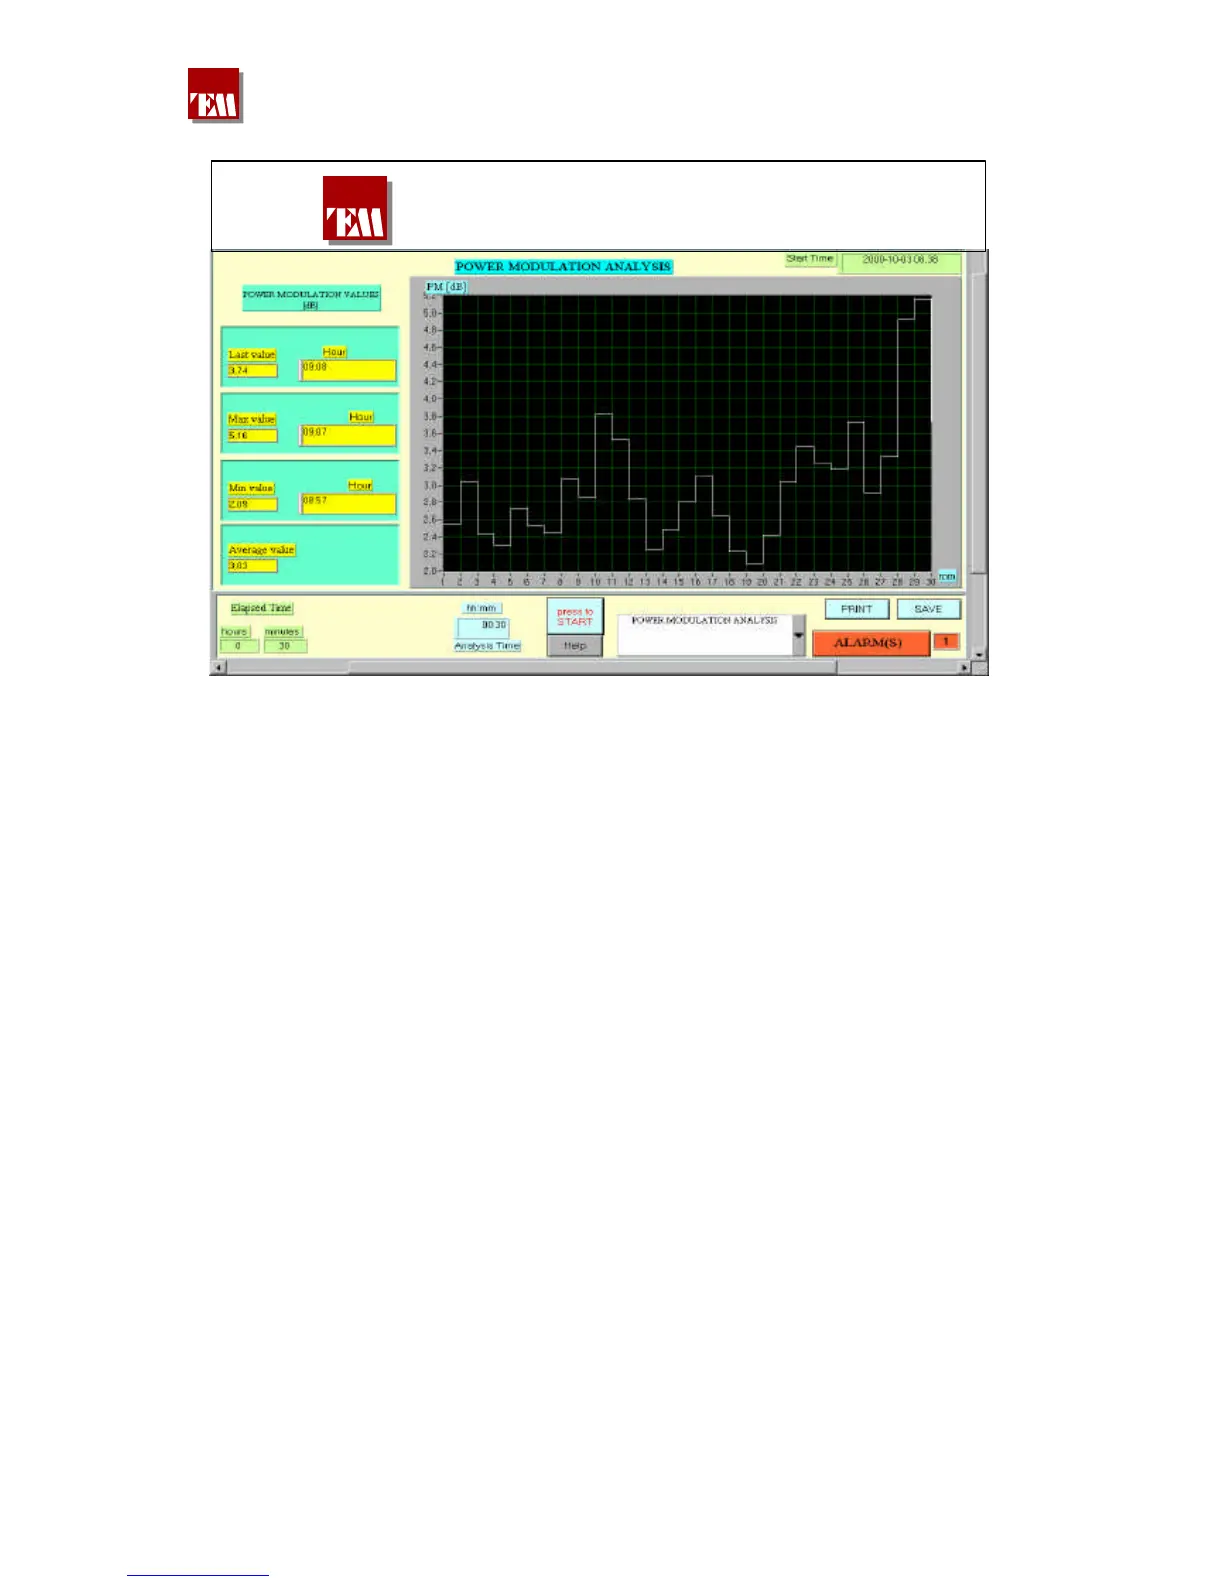
In the upper graphs the peak modulation statistic parameters of a broadcast network
observed during 10 minutes period are reported. It can be observed that the 12000 peak
measurement samples detected lead to consider that the network is on the limit of the allowed
deviation; the last K diagram clearly shows the spoken broadcasting for the first two minutes
followed by a music passage (K>4), at the end other two minutes spoken (K<3).
By entering HELP on the window the followed rule appears (CEPT 54-01). The observation time
period is edited in ANALYSIS TIME followed by START.
380 221 R02 Pag. 49