Kutzler & Kokol-Voljc: Introduction to D
ERIVE
527
Now the
Plot Expression
button is available, and you are ready to plot the polynomial.
Draw the polynomial’s graph using the
Plot Expression
button .
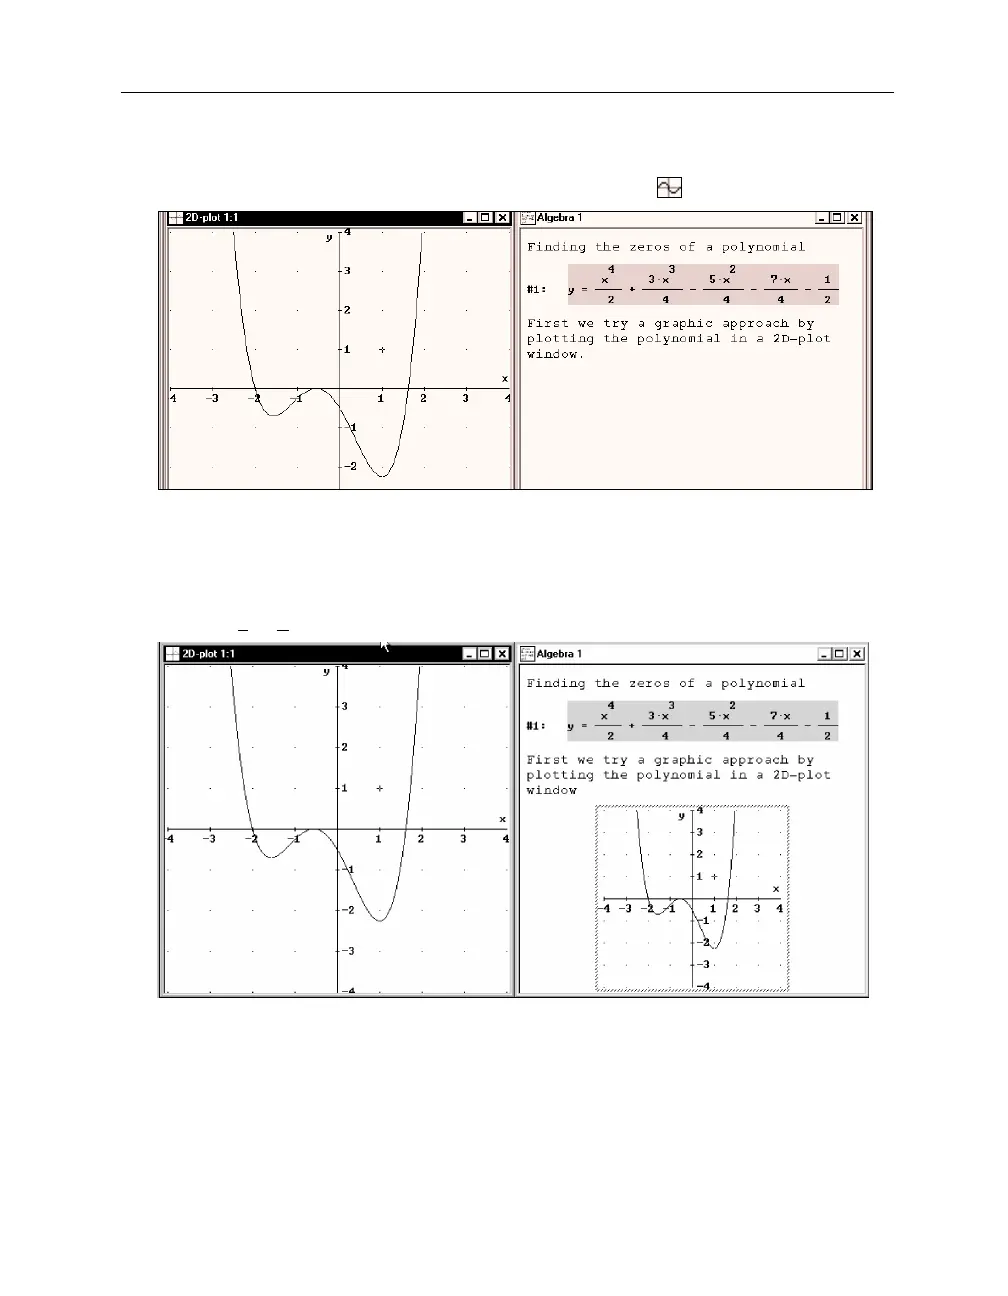
Now we have both an algebraic and a graphical representation of the polynomial available.
However, the graphical representation is
outside
the algebra window’s worksheet in its own
independent plot window.
Copy the current plot window into the algebra window’s worksheet by using the 2D-plot
window’s
File>Embed
command.
This “freezes” the current status of the plot window into the worksheet. The plot window is
interactive; the embedded plot image is not. The embedded plot image can be brought back into
an interactive plot window at any time with a double mouse click.
The graphical representation is useful for exploring the polynomial’s zeros. However, from the
current picture it is not clear whether the polynomial has two, three, or four distinct zeros. An
answer can be found by inspecting the graph with the moveable graphics cross. Its coordinates
are displayed in the status line, which now shows the cross at the initial position (1,1):