Chapter 5: Linear Systems Section 1: Using Graphs & Tables
Topics in Algebra 1 © 2001, 2002 Texas Instruments Teacher Notes 5-12
Activities
Scoring: You get two
attempts to answer the
problem. You earn 2 points
for a correct answer on the
first try, 1 point for a correct
answer on the second try.
You can earn up to 12 points.
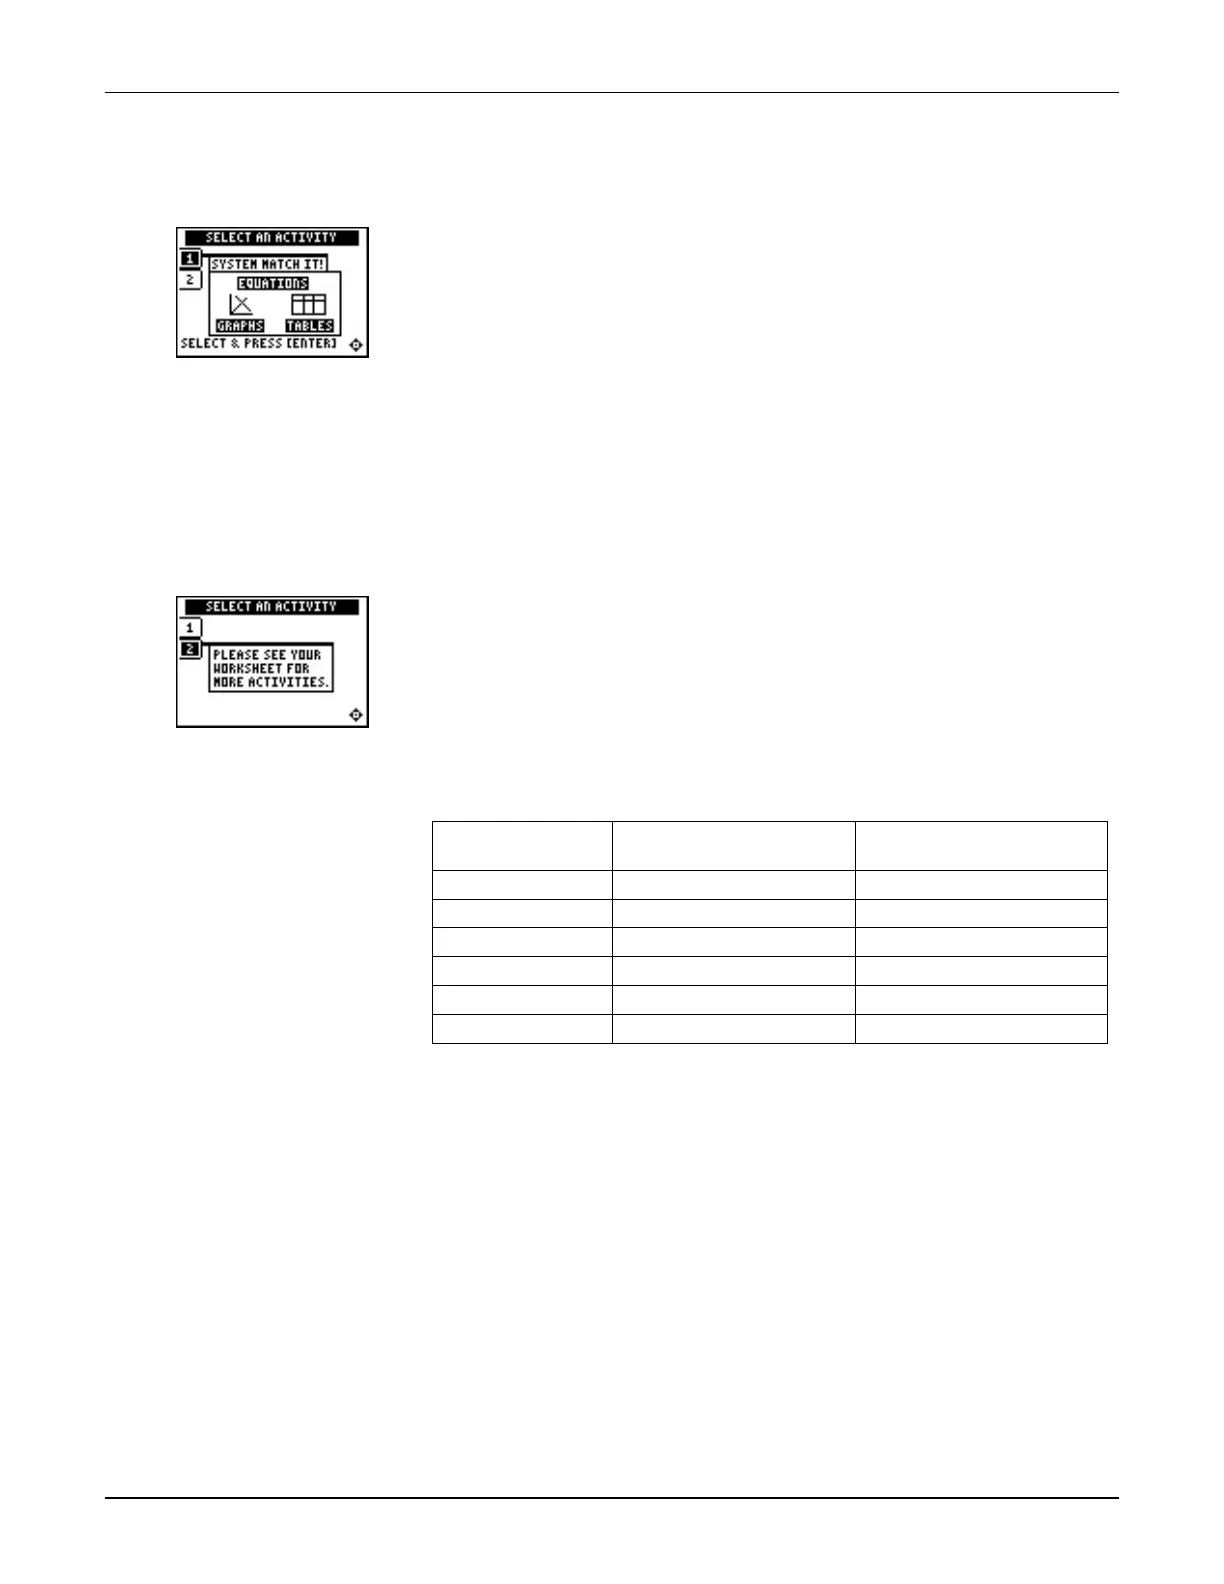
System Match It!
Tell students to:
1. Select the correct answer to the question. Questions include:
•
Selecting the graph that correctly illustrates the system.
•
Selecting the system that correctly describes a graph.
•
Selecting the correct solution of a system given a table.
2. Record their scores.
Remind students that the graphs might appear very close together
on the screen. They need to use their knowledge about both the
functions and the graph to determine the correct answer.
Notes: See ³ TIps™ 4:
Creating a Table to help you
with tables.
See ³ Try-It!™ in Chapter 2
Sections 1 and 2 for working
with tables and linear
equations.
Worksheet Activity
Students investigate the entry fee to Blue Lake. They compare the
entry fees with and without a membership fee.
a. Students should gather information from the problem to write
a system of equations for the investigation. Filling in the table
with all of the calculations written out helps students develop
the equations inductively.
Days at the
Lake
Cost Without
Membership
Cost With Membership
1 $12(1) = $12 $48 + $6(1) = $54
2 $12(2) = $24 $48 + $6(2) = $60
3 $12(3) = $36 $48 + $6(3) = $66
4 $12(4) = $48 $48 + $6(2) = $72
… … …
D 12D 48 + 6D
b. Variables are suggested. Review the concept of independent
and dependent variables with the students.
Let C = the entry cost to the lake.
Let D = the number of days Pat’s family goes to the lake
during one summer.
C = 12D
C = 6D + 48 (Students could also enter 48 + 6D.)

 Loading...


