30.34515
37.9515526.93515
36.4514523.72515
34.9513520.51515
33.2512533.38010
31.7511531.07010
30.5510530.96010
29.159526.85010
The access time in Table 3 can be estimated with this model equation:
T
av
= a + bN
r
+ cN
c
+ dN
c
N
r
where
Nr = number of matrix rows Nc = number of matrix columns
a = 15.7766 E-3 c = -754.840 E-9
b = 33.9161 E-8 d = 21.2832 E-6
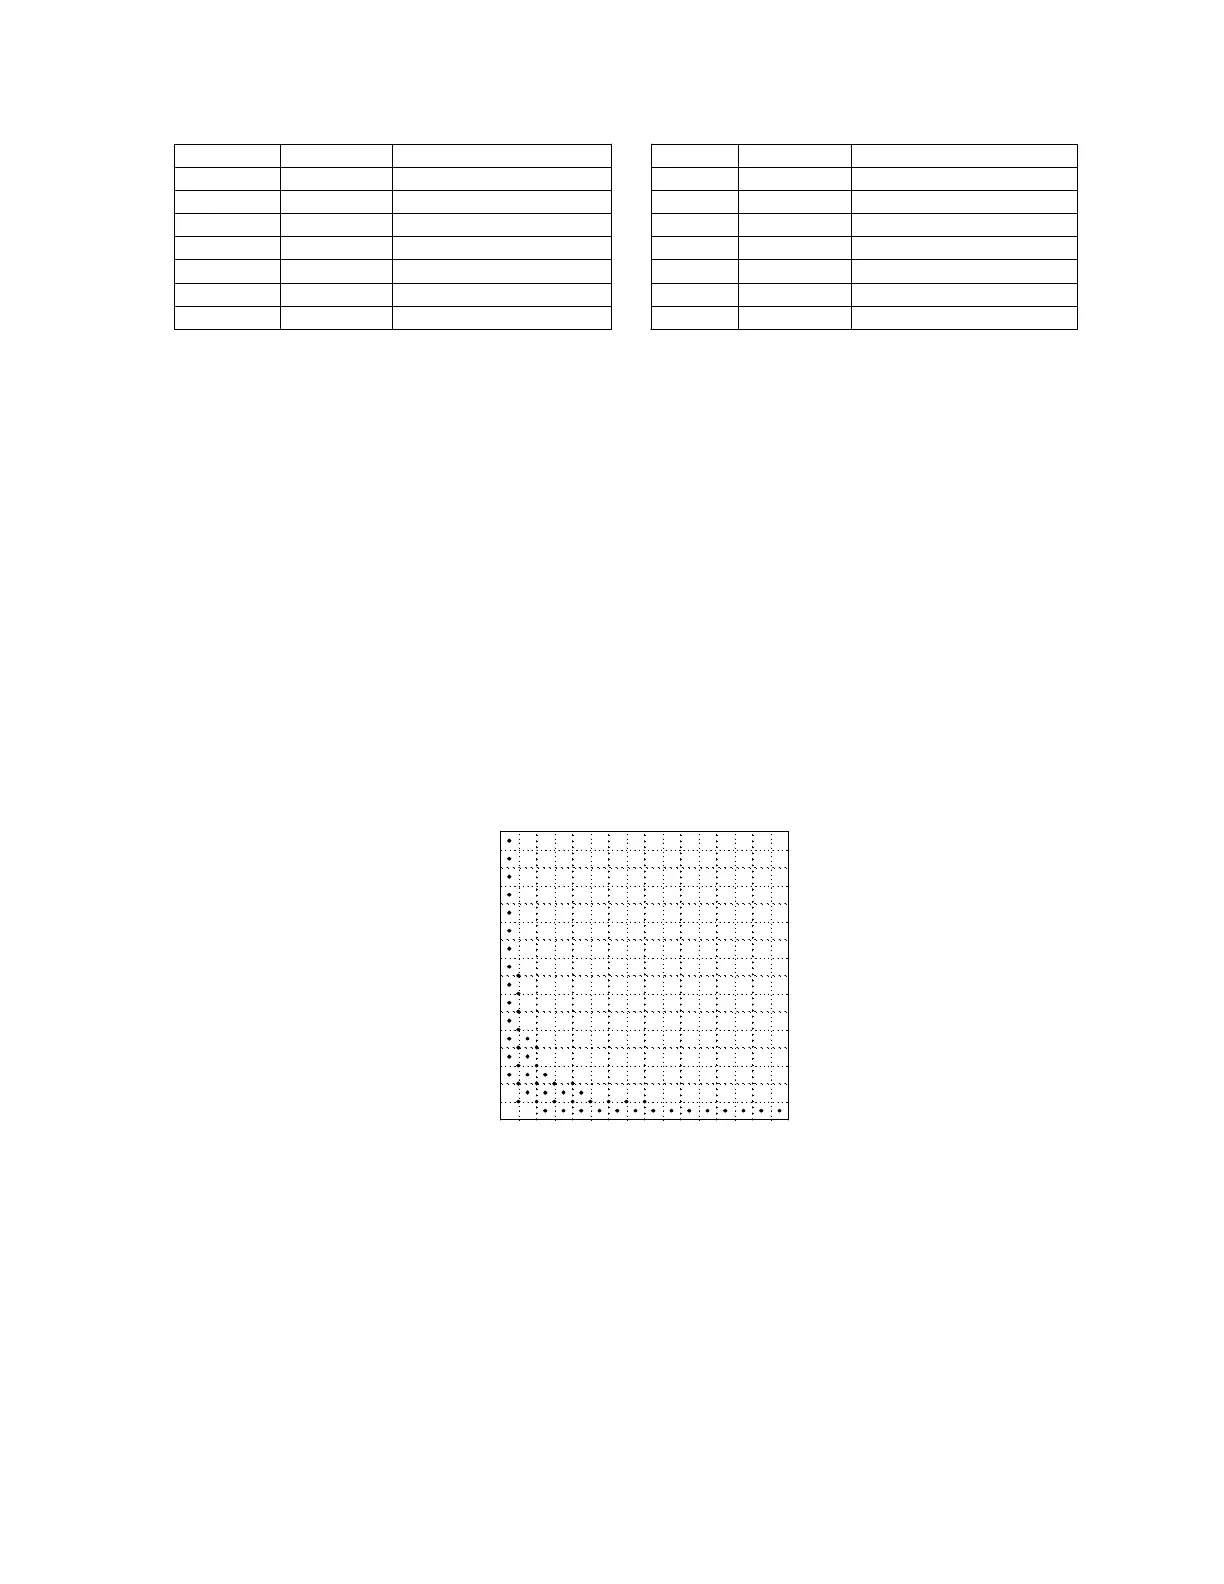
This model equation has a maximum relative error of about 6.7%, but the RMS error is about 1.5%, so
it may be useful to estimate access times for matrices not shown in the table. The graph below shows
the points used to generate the model equation, which are the points from table 3.
Sample points
Number of rows
0
20
40
60
80
100
120
140
160
Number of columns
0
20
40
60
80
100
120
140
160
Table 4 shows the mean time to access an element in a few of the matrices from table 3, but using
indirection instead of accessing the elements directly. The indices are local variables. The mean
overhead, compared to direct access, is about 5.7 mS.
7 - 51