EN 9
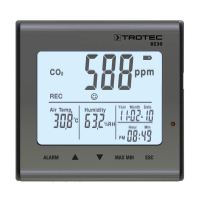
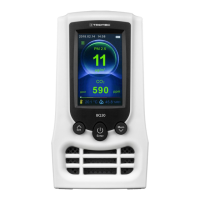
CO₂ air quality data logger BZ30
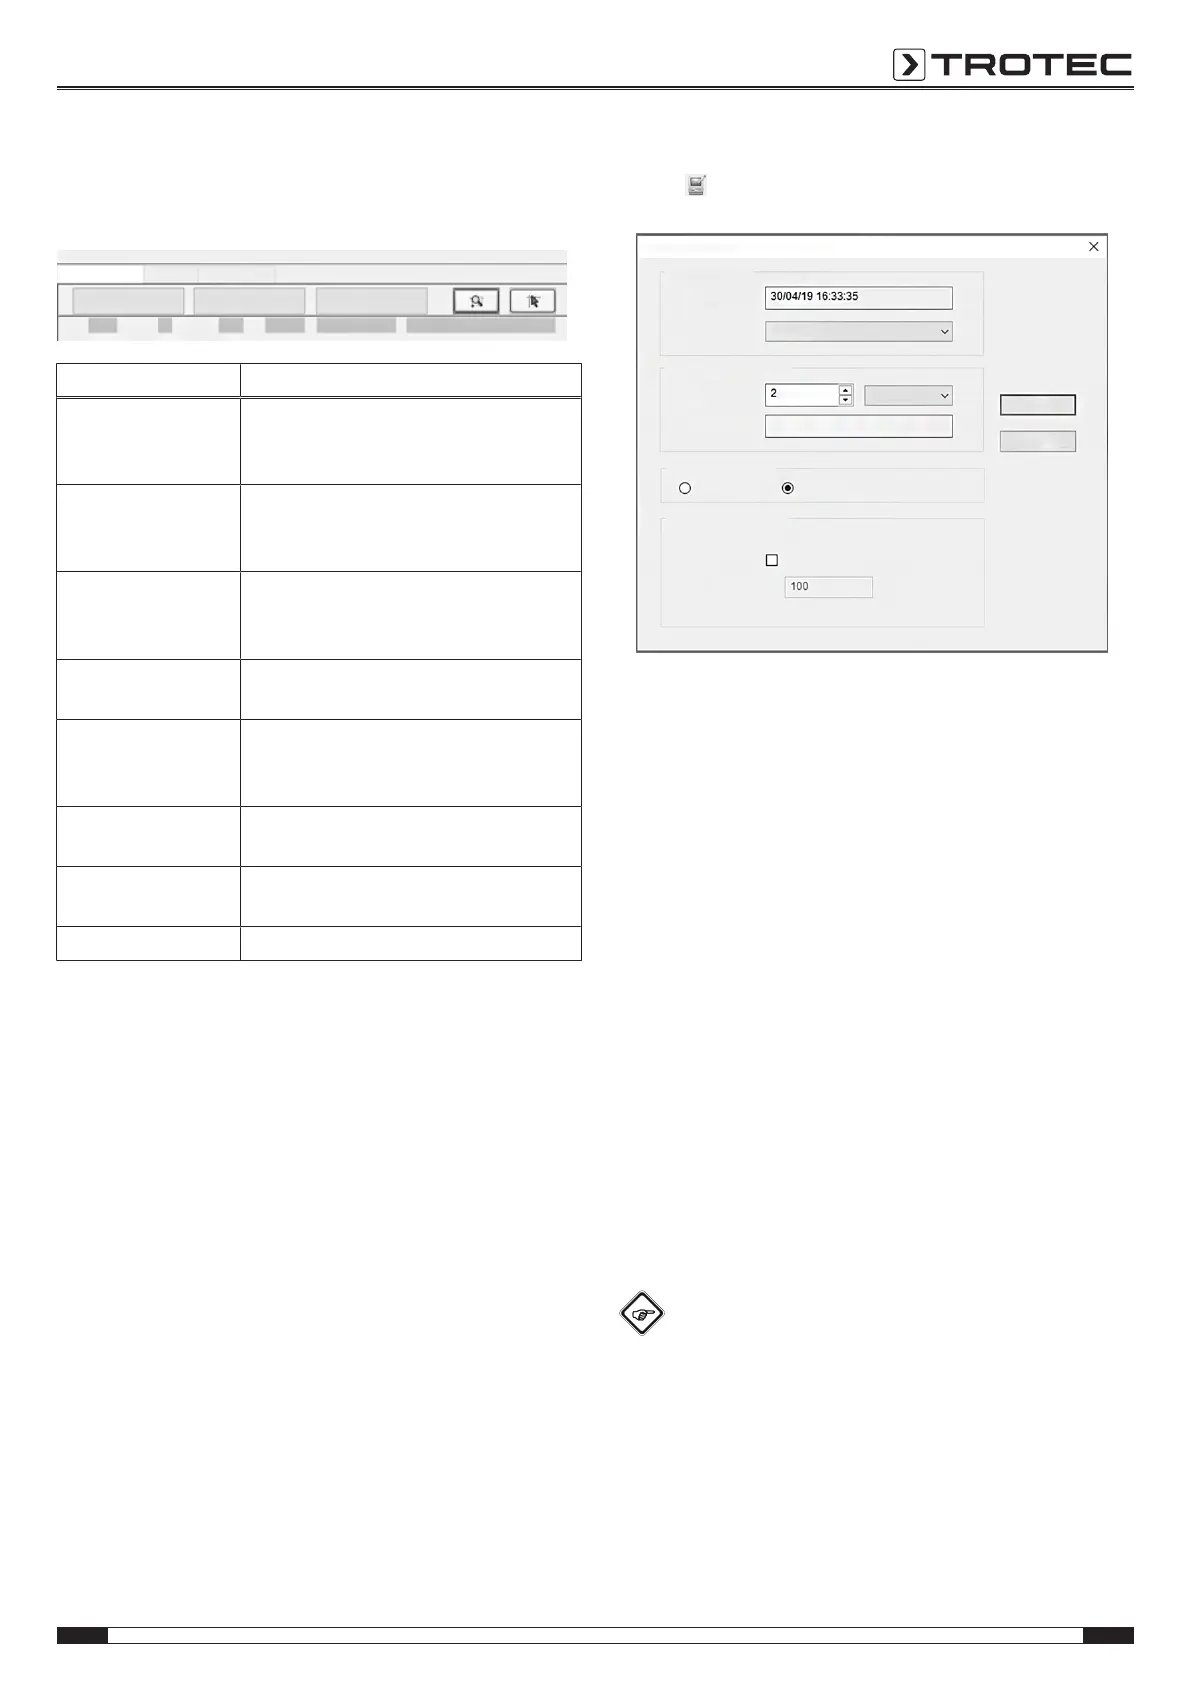
Diagram control
In the following you will find information regarding the subitems
of the diagram control section(4).
Data graph
Data list
Setting the scale format
Data overview
Setting the graph format
Undo zoom
[Temperature]
[Relative humidity]
ppm
[CO2]
°C
%RH
Button Function
Data graph Displays the graph with the recorded
values for CO
2
, temperature and relative
humidity.
Setting the scale
format
Opens the dialog window for adjusting
the horizontal and vertical scales of the
individual channels.
Data list Changes from the graphic display of the
measured values to a list indicating the
individual measuring points.
Data overview Displays a summary of the gathered
data.
Setting the graph
format
Opens the dialog window for adjusting
the background colour, grid lines and
depiction of the three channels.
Undo zoom Indicates the total view of the data
graph.
Zoom Allows to zoom into sections of the
graph.
Cursor Allows to select individual data points.
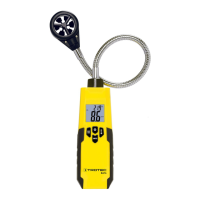
Adjusting the data logger settings
Click the icon on the toolbar(2) to open the Data logger
settings dialog window.
Data logger settings
Time settings
Current time
Date format
DD/MM/YY
Sampling setting
Sampling rate
Second
Recording time
1day 4hours 5minutes 36seconds
OK
Cancel
Starting recording
Automatically
Manual
CO2 alarm settings
Limit value alarm
Alarm Value
1. Time settings
The current system time is displayed in the Current time
field.
The date format can be set as year/month/day, month/day/
year or day/month/year.
2. Sampling setting
The Sampling setting field prompts the device to record the
measured values at a certain frequency. In the combo box
on the left, you can enter a specific value for the sampling
rate. From the combo box on the right, you can select the
time unit. The Recording time combo box shows the
maximum recording time (depends on the set sampling
rate).
3. Starting recording
The Manual and Automatic selection options allow for the
user to start data logging immediately after exiting the
setting window (Automatic) or to manually start at a later
point in time by pressing the respective button (Manual).
4. CO2 alarm settings
If the Limit value alarm checkbox is checked, the user can
enter the alarm value (in ppm). If the respective measured
value is beyond the alarm limit, the device triggers an
alarm.
Info
Prior to setting the logger to recording mode, the
logger settings [Data logger settings] must always be
made first! In this process, it is irrelevant whether the
settings are changed or remain the same. All saved
data are permanently deleted when set-up is complete.
To save those data before they are deleted, click
Cancel and then download the data.