52
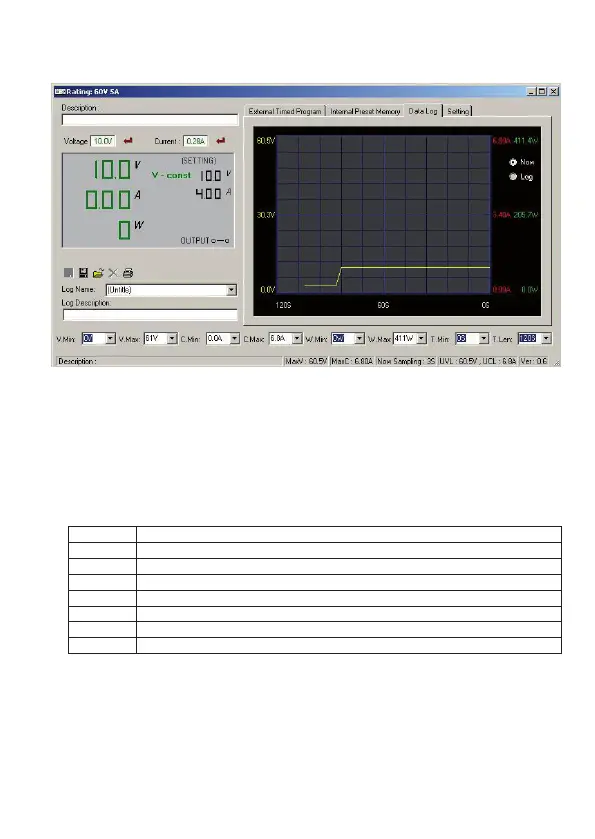
Data Log
You can see the real-time / recorded voltage-current chart in this function.
You can save, export, import, delete saved record and print the setting. The operation is similar to
those in the basic operation.
• To view a recorded chart, select from the “Log Name” drop-down list. You can also click the “import”
icon and select the record from an external le.
• Switch between the recorded chart (Log) and real-time chart (Now) by selecting the corresponding
bullet to the right of the chart.
• Use the drop-down lists below the chart to set the parameters of the chart.
V. Min The minimum voltage level shown in the chart.
V. Max The maximum voltage level shown in the chart.
C. Min The minimum current level shown in the chart.
C. Max The maximum current level shown in the chart.
W. Min The minimum power level shown in the chart.
W. Max The maximum power level shown in the chart.
T. Min The time shift of the showing chart.
T. Len The length of the record shown in the chart.