1-19
IM 04L42B01-01E
Overview of Functions
1
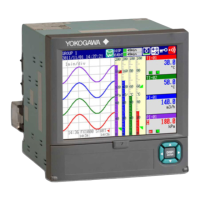
CircularDisplay
The circular display shows the measured data on a circular time axis in place of the trend
display (T-Y). The time per revolution can be set in the range of 20 minutes to 4 weeks.
For the operating procedure, see section 5.12.
Grid
Time per revolution
Date/time
Time scale (main scale marks and small scale marks)
Scale
Channel number corresponding to the scale value
Message mark (position where the message was written
)
Message This position is the time reference position.
The time axis is set so that the time reference
position is hour 0.
The reference position can be offset in unit of one hour.
Trip line (up to four lines)
To change the channel display color, see section 5.5.
To change the waveform line width, see section 5.10.
To display the waveforms of all channels, see section
4.2.
See section 5.10
See section 5.12
See section 5.4
See section 5.1
Waveform (displayed using the channel display color)
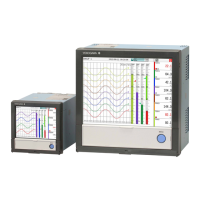
Quarter cycle display
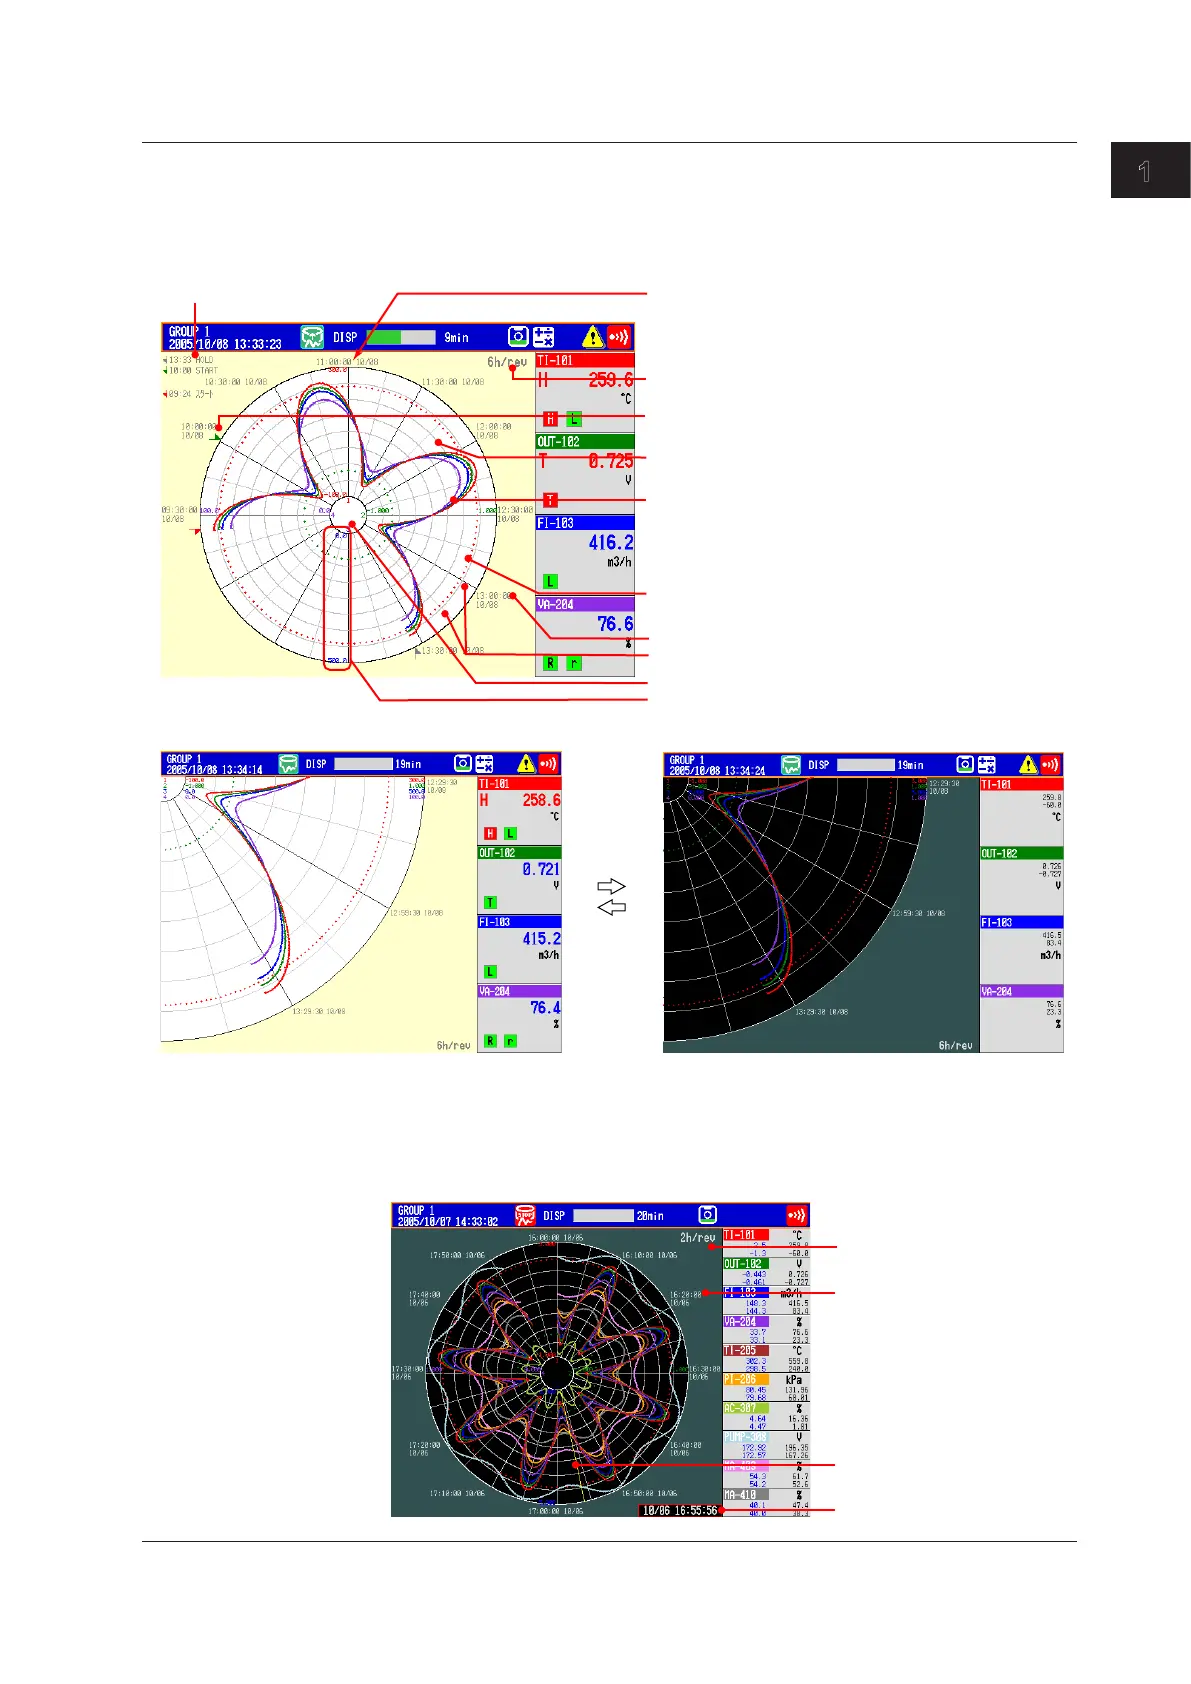
Simplified historical trend
• HistoricalTrendDisplay
Displays the past data for each time of revolution. The displayed contents and
operating procedure are the same as the historical trend of the T-Y display. Half
screen display is not possible.
Cursor (yellow line)
Time per revolution
Date/time
See section 5.12
See section 5.12
1.3Display
 Loading...