16
IM 12D06D05-01E
4-1. Main display functions
Go to trend screen
Go to zoom screen
Go to status screen
Go to maintenance screen
Tag :EXAxt ISC450
3.760
25.0
mS/cm
16.64
+
Figure 4-1. Main Display
Aheart“ ”markislitontheright-uppercornerofthe
screenwhenHARTcommunicationisactive.An“Χ”
mark is lit when HART communication is abnormal.
Nothing appears when HART communication is not
used.
Notethatthe“Χ”markmayappearduetooutput
signal noise or the like even when HART communica-
tion is not used. There is not problem when HART
communication is not used. Continue operation while
ignoring the mark.
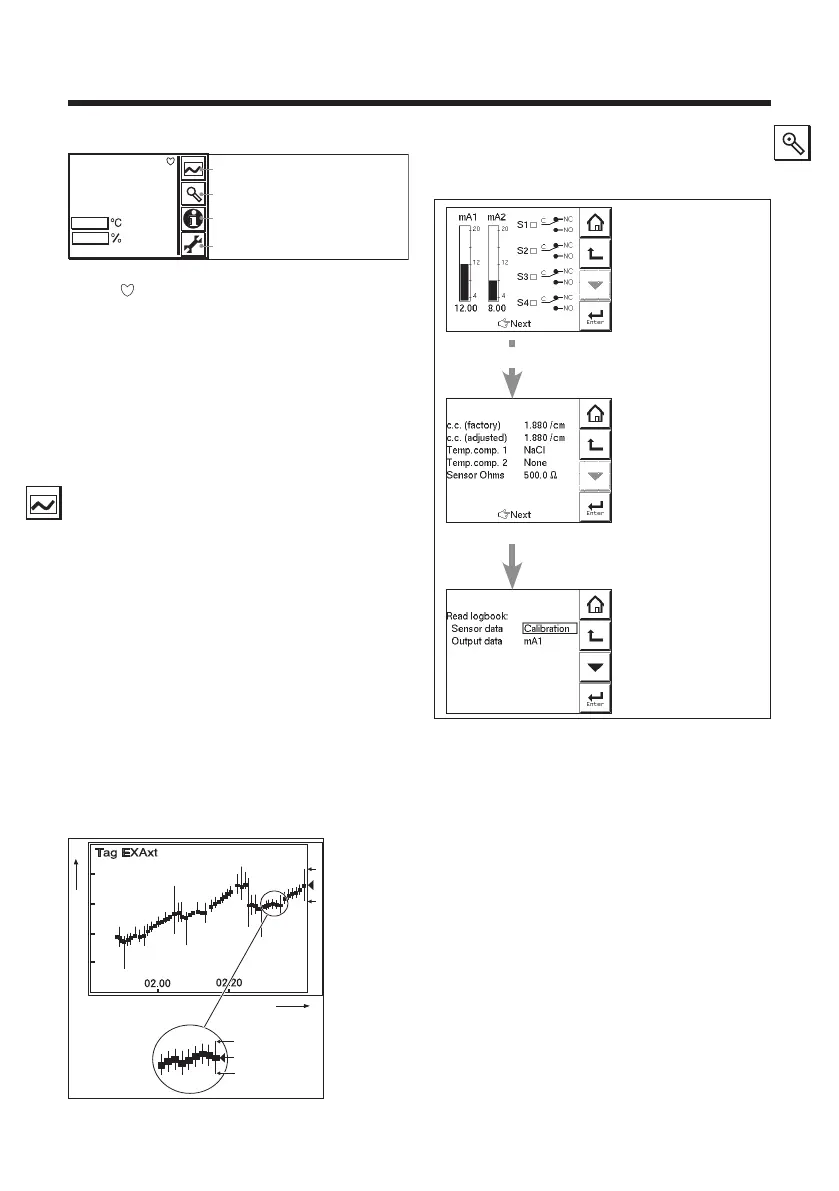
4-2. Trending graphics
Pressing the button changes the display
into a graphical mode in which the average
measured value is shown on a time scale. The
“Live”valueisalsodigitallydisplayedinatext
box. The time scale ( X-axis) and the primary
valuescale(Y-axis)aresetinthe“DISPLAY
SETUP”menu.Thefullscreendisplaysatrend
of 51 points that represent the average of the
selected time interval. The analyzer samples
the measurement every second. The trending
graphic also shows the maximum and minimum
measured value in that interval.
Forexampleifthetimescaleissetto4hours,
thenthetrendisshownfor4hourspriortothe
actual measurement. Each point on the trend
linerepresentstheaverageover4*60*60/51=
282 measurements (seconds).
Maximum
Minimum
Minimum
Maximum
Average
Live reading
ISC
SC
T
120.0
90.0
60.0
30.0
109.3 µS/cm
450
Figure 4-2. Trend screen
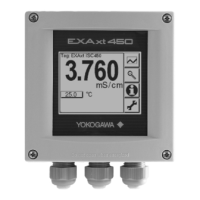
4-3. Zoom in on details
This button gives access to the diagnostic infor-
mation of the analyzer. The following messages
will appear under normal (default) conditions:
- Home key back to
mainscreen.
-Onelevelup.
-Scrollchoices(grey
means deactivated).
- Enter selected data
or choice.
Firstzoomscreen
gives you inside
into the parameters
involving current
measurement. All
following zoom
screens give
additional information
about the device and
lead to logbook data.
Next
Next
Next
Next
Figure 4-3. Detail screen
4. OPERATION OF EXAxt ISC450G
 Loading...