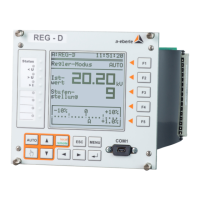
Basic description of the Transformer Monitor
LEREF "Verzeichnis Ueberschrift" \* MERGEFORMAT Index
Fehler! Verwenden Sie die Registerkarte 'Start', um Verzeichnis Ueberschrift
dem Text zuzuweisen, der hier angezeigt werden soll.Inhaltsverz
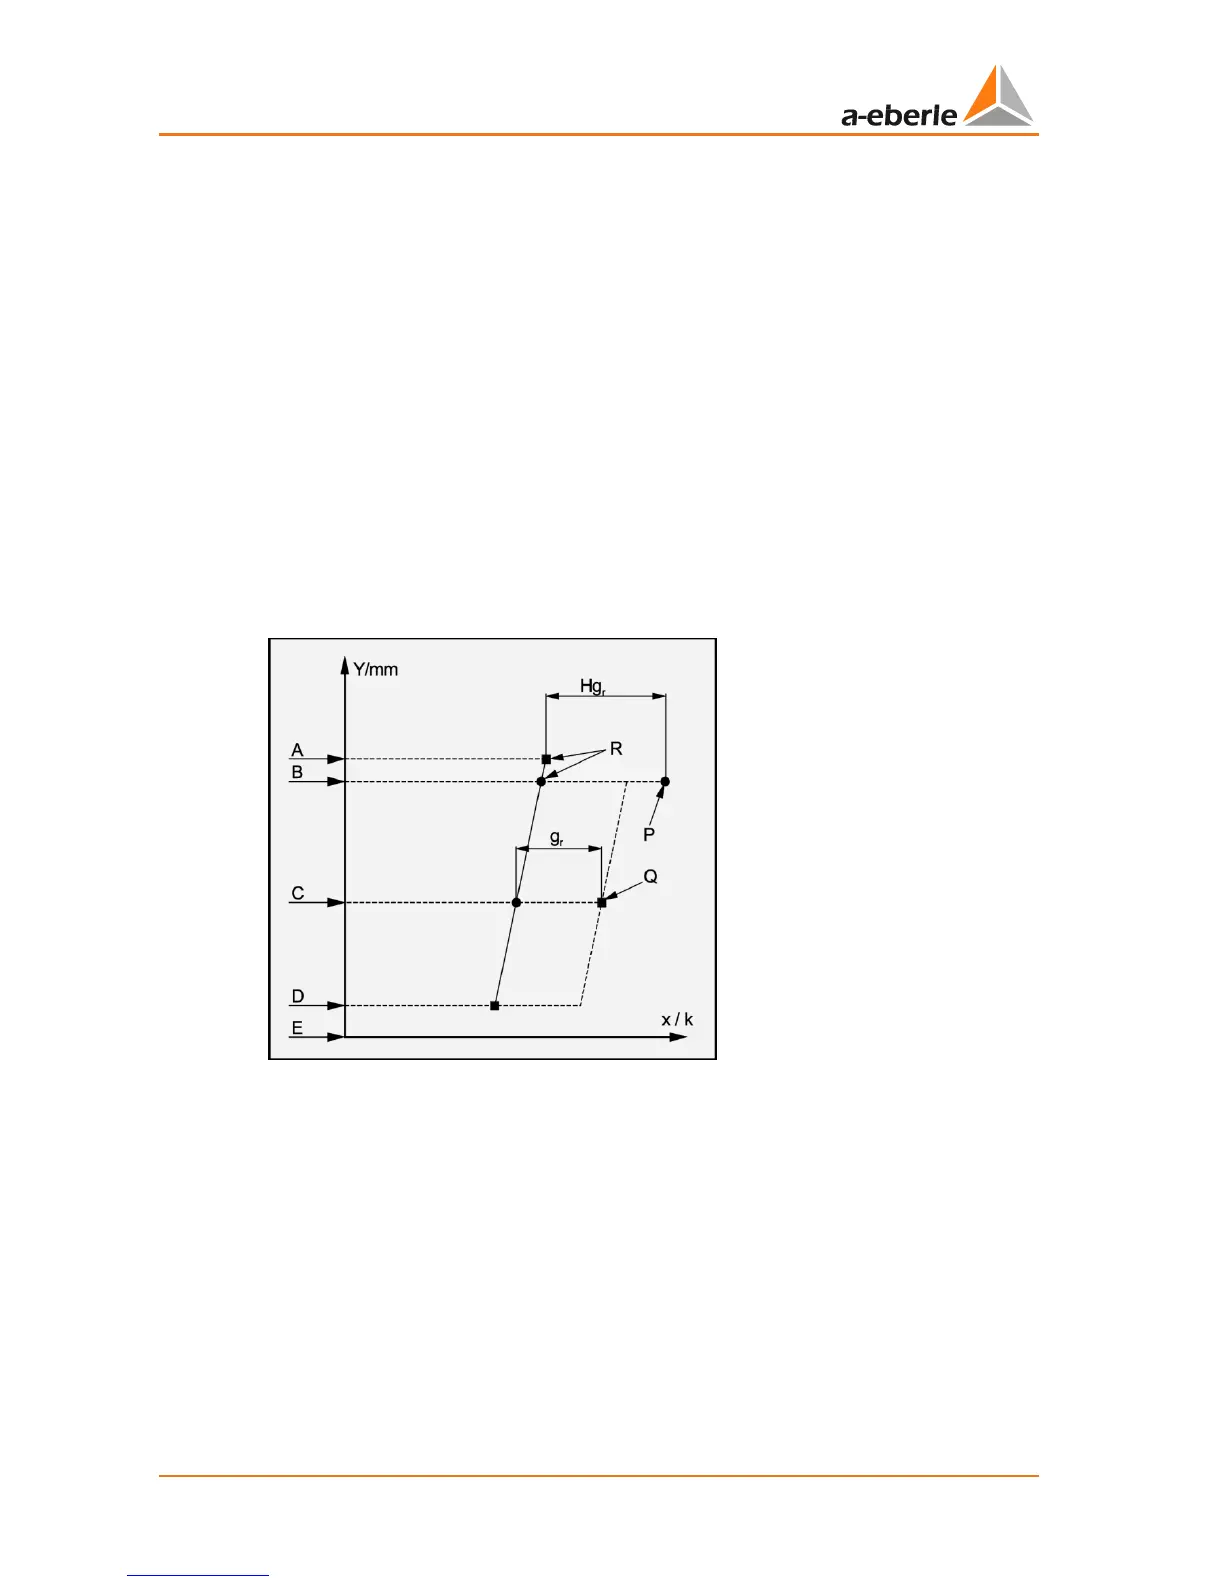
The thermal situation in the transformer can be displayed in a graphic (see Figure 2). Please
note that it is a simplified view of a complex situation. The 'simplification' is based on the
following assumptions:
0 the oil temperature in the tank increases linearly from the bottom to the top
0 the average temperature of the winding is linearly parallel to the oil temperature with a
constant temperature differential gr increasing from bottom to top
0 the hot-spot temperature (P) is higher than the temperature of the winding at the up-
per (hot) end of the winding. The increase in temperature between the hot spot in the
winding and the oil temperature at the top of the tank is specified as constant H
gr
(hot
spot to top oil gradient). Studies have shown that the factor H can vary between 1.0
and 2.1 based on the size, short-circuit impedance and winding design of the trans-
former.
The abbreviations used in the diagram are explained below. Measured values are indicated
by a solid square ( ), calculated values are indicated by a solid point ( ).
Figure 2: Thermal model based on IEC