Do you have a question about the ABB M4M 30 and is the answer not in the manual?
Critical safety advice to prevent serious injury or death during operation.
User responsibility for network security to protect the analyzer from breaches.
Key features including real-time data, energy, power quality, data logging, and HMI.
Comprehensive technical specifications for auxiliary power, measurement accuracy, and inputs.
Instructions for the physical installation and mounting of the M4M 30 device.
Electrical connection schematics for various network types and configurations.
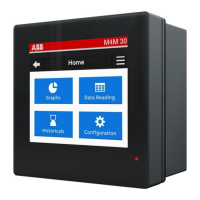
Overview of the device's main menu structure and its four primary sections.
Explanation of the icons and symbols used for navigating the device's user interface.
Methods for configuring settings, including selecting from lists or manual input.
Mandatory initial setup to define a 5-digit password for configuration protection.
Configuring current transformer ratios (primary/secondary) for accurate current measurements.
Configuring voltage transformer ratios for accurate voltage measurements.
Device settings including password modification, language, reset options, and device information.
Configuring programmable I/O slots for pulse, tariff inputs, and alarm/communication outputs.
Setting up and monitoring simple alarms based on parameter values, thresholds, and delays.
Configuration of communication protocols like Bluetooth, Modbus RTU/TCP/IP, Profibus, and BACnet.
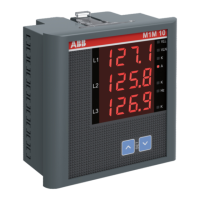
Display of live measurements for voltage, current, active, reactive, and apparent power.
Reading of imported, exported, and net energy values, including CO2 and currency equivalents.
Monitoring THD, unbalances, power factor, and cosphi for power system analysis.
Reviewing logged alarms, warnings, and errors, with timestamps for each event.
Storing and visualizing demand values over time for up to 25 parameters, showing trends.
Recording and viewing maximum and minimum demand values for selected parameters.
Visualizing energy consumption curves based on stored snapshots for up to 20 parameters.
Visualizing signal samples for voltage and current over two line cycles to show network condition.
Displaying harmonic magnitudes as percentages of the fundamental harmonic.
Graphical representation of voltage and current phase relationships and values.
| Brand | ABB |
|---|---|
| Model | M4M 30 |
| Category | Network Hardware |
| Language | English |