10
Example Scenarios
Here are some example scenarios to help you understand how to use the
information on your screen. If you are not sure about what to do, consult
your health care professional.
What you see What it means
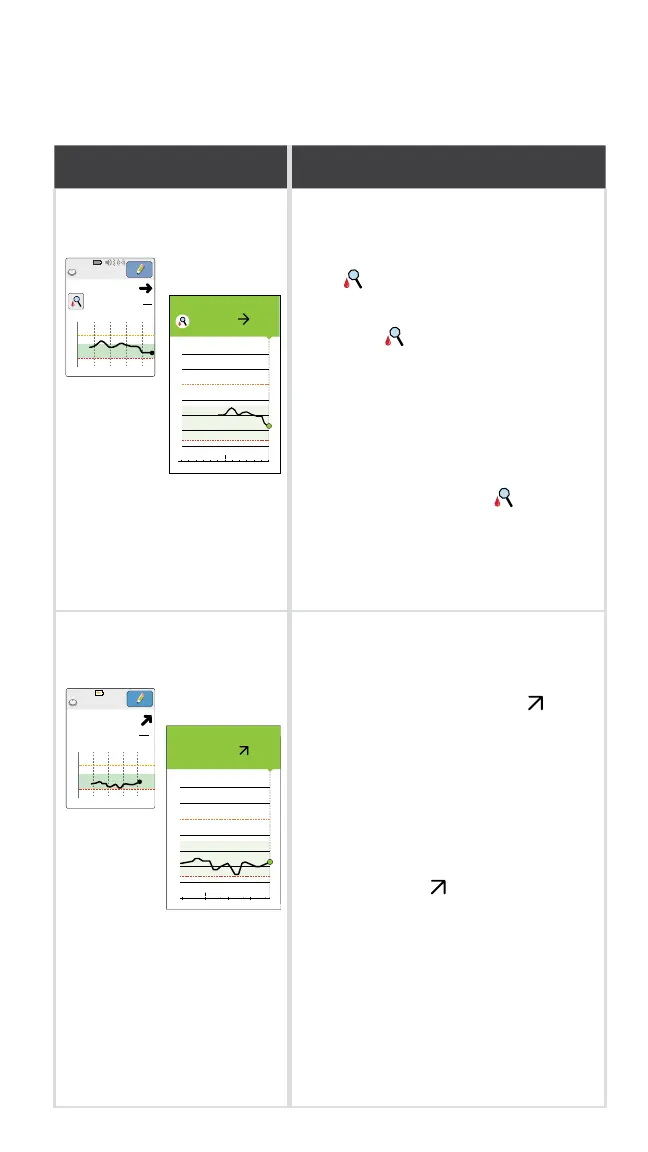
When you wake up: When you wake-up on your rst day
of wearing a Sensor, your current
glucose is 110mg/dL. There is also
the
symbol on the screen.
During the rst 12 hours of Sensor
wear the
symbol will display,
and you cannot use Sensor values
to make treatment decisions during
this time. Conrm Sensor glucose
readings with a blood glucose test
before making treatment decisions
during the rst 12 hours of Sensor
wear when you see the
symbol.
Before breakfast:
App
Reader
350
250
150
50
8pm 2am 8am
mg
dL
115
Ends in 2 days
8:06am
Before breakfast, your current
glucose is 115mg/dL. The graph
shows that your glucose is going up
and so does the trend arrow
.
Consider what might be causing
your glucose to go up and what you
might do to prevent a high glucose.
For example:
• How much insulin should you take
before your meal?
• Since you see
, should you
consider taking a little more
insulin?
App
Reader
mg
dL
110
Ends in 14 days
7:03am
350
250
150
50
6pm 12am 6am