OVER
18 Appendix B: Specications (con’t)
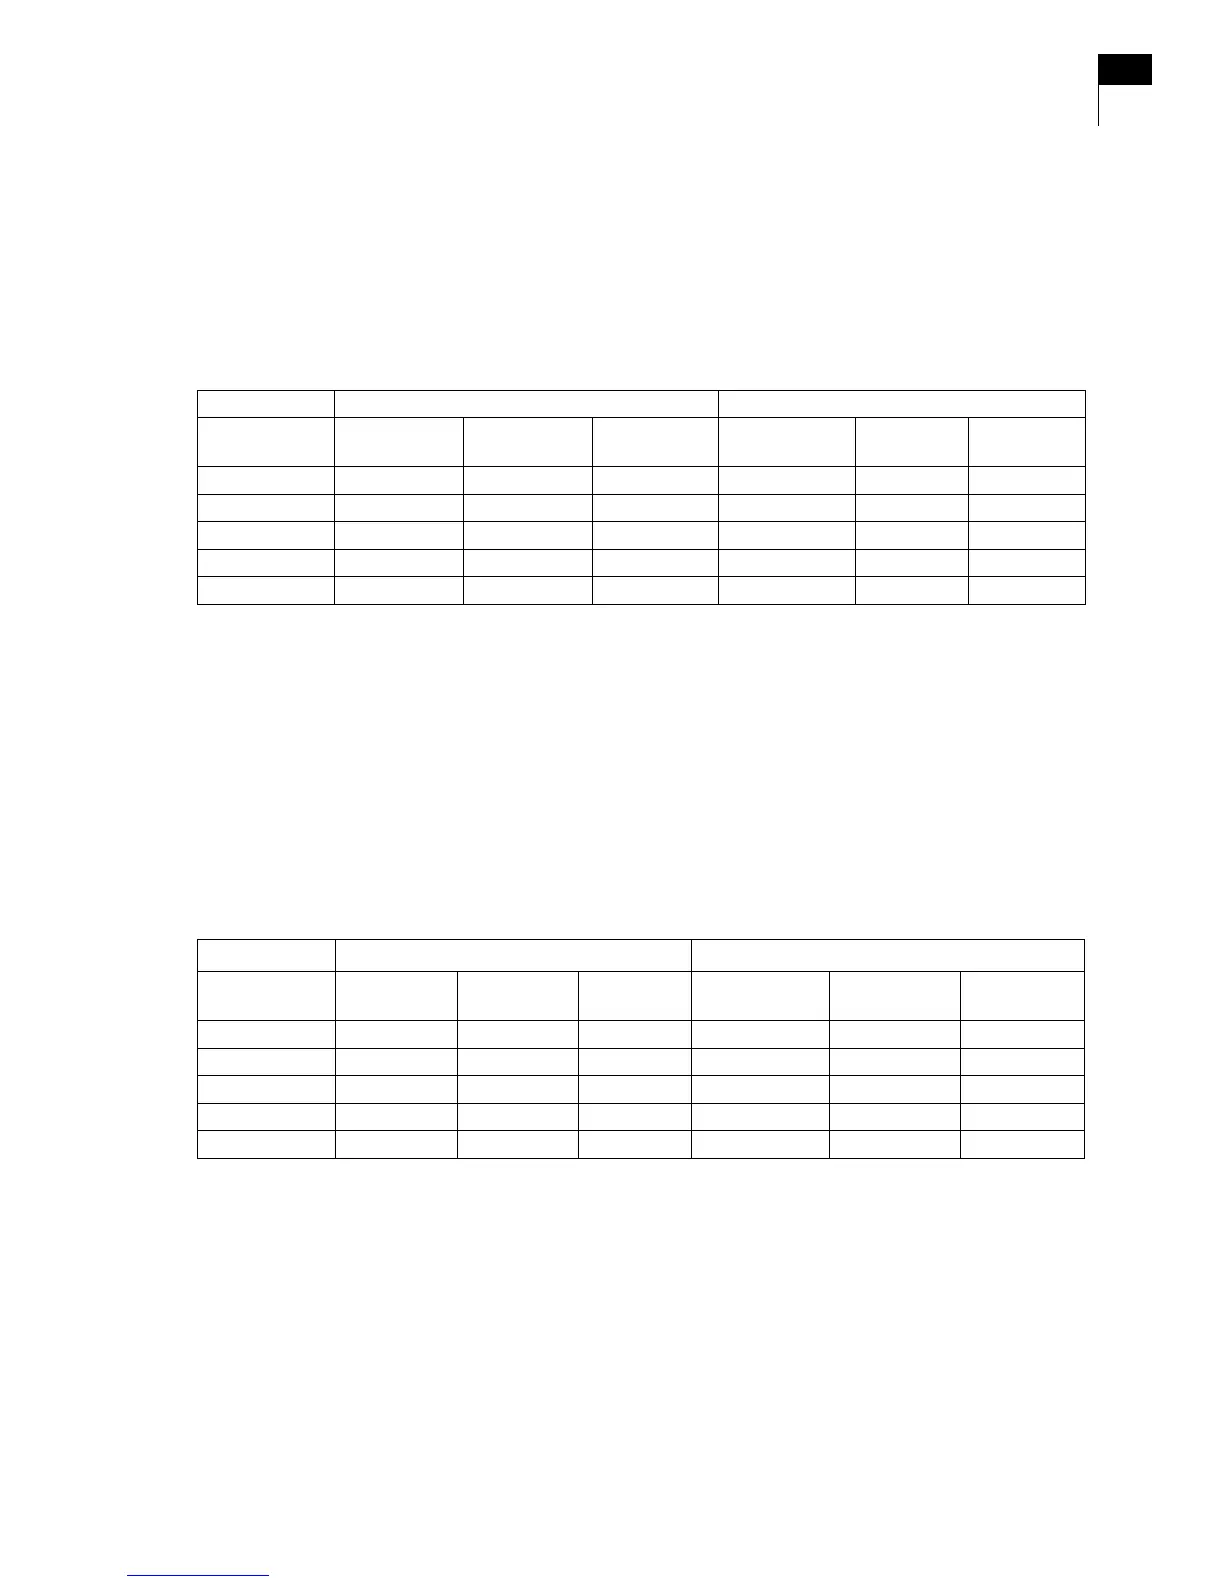
Detection of Low Glucose
See Table 7 below for detection of low glucose. As an example, when the threshold alarm was set at 70 mg/dL
(during the day), 56 % of the low glucose events were detected by FreeStyle Navigator.
Table 7. Low Glucose Detection
DAY NIGHT
Low Alarm
Setting (mg/dL)
Day True
Alarms*
Day Missed
Alarms**
Day False
Alarms***
Night True
Alarms*
Night Missed
Alarms**
Night False
Alarms***
% (n/N
†
) % (n/N) % (n/N) % (n/N) % (n/N) % (n/N)
65 46 (56/121) 54 (65/121) 19 (18/95) 80 (12/15) 20 (3/15) 41 (11/27)
70 56 (98/176) 44 (78/176) 16 (21/132) 79 (19/24) 21 (5/24) 40 (14/35)
75 59 (130/219) 41 (89/219) 9 (15/161) 72 (23/32) 28 (9/32) 37 (14/38)
85 61 (189/308) 39 (119/308) 7 (17/228) 65 (22/34) 35 (12/34) 33 (14/43)
* True Alarms are the percentage of time the glucose level was below the threshold and an alarm was activated.
** Missed Alarms are the percentage of time the glucose level was below the threshold and an alarm was not activated.
*** False Alarms are the percentage of time an alarm occurred but the glucose level was not below the threshold setting.
†
n/N is the (n)umber of observations divided by the total (N)umber.
Detection of High Glucose
See Table 8 for detection of high glucose. As an example, when the threshold alarm was set at 240 mg/dL
(during the day), 78 % of the high glucose events were detected by FreeStyle Navigator.
Table 8. High Glucose Detection
DAY NIGHT
High Alarm
Setting (mg/dL
Day True
Alarms*
Day Missed
Alarms**
Day False
Alarms*
Night True
Alarms**
Night Missed
Alarms***
Night False
Alarms***
% (n/N
†
) % (n/N) % (n/N) % (n/N) % (n/N) % (n/N)
180 89 (561/630) 11 (69/630) 11 (68/628) 69 (29/42) 31 (13/42) 7 (3/44)
240 78 (295/376) 22 (81/376) 12 (47/393) 41 (12/29) 59 (17/29) 25 (7/28)
270 70 (193/274) 30 (81/274) 12 (32/265) 21 (3/14) 79 (11/14) 36 (5/14)
300 61 (117/192) 39 (75/192) 12 (20/161) 12 (1/8) 88 (7/8) 33 (1/3)
* True Alarms are the percentage of time the glucose level was above the threshold and an alarm was activated.
** Missed Alarms are the percentage of time the glucose level was above the threshold and an alarm was not activated.
*** False Alarms are the pe
rcentage of time an alarm occurred but the glucose level was not above the threshold setting.
†
n/N is the (n)umber of observations divided by the total (N)umber.
Section 18 161
Appendix B: Specications