Interpreting Sensor Readings
Sensor Readings
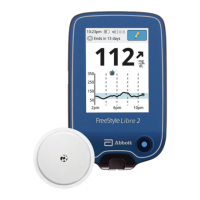
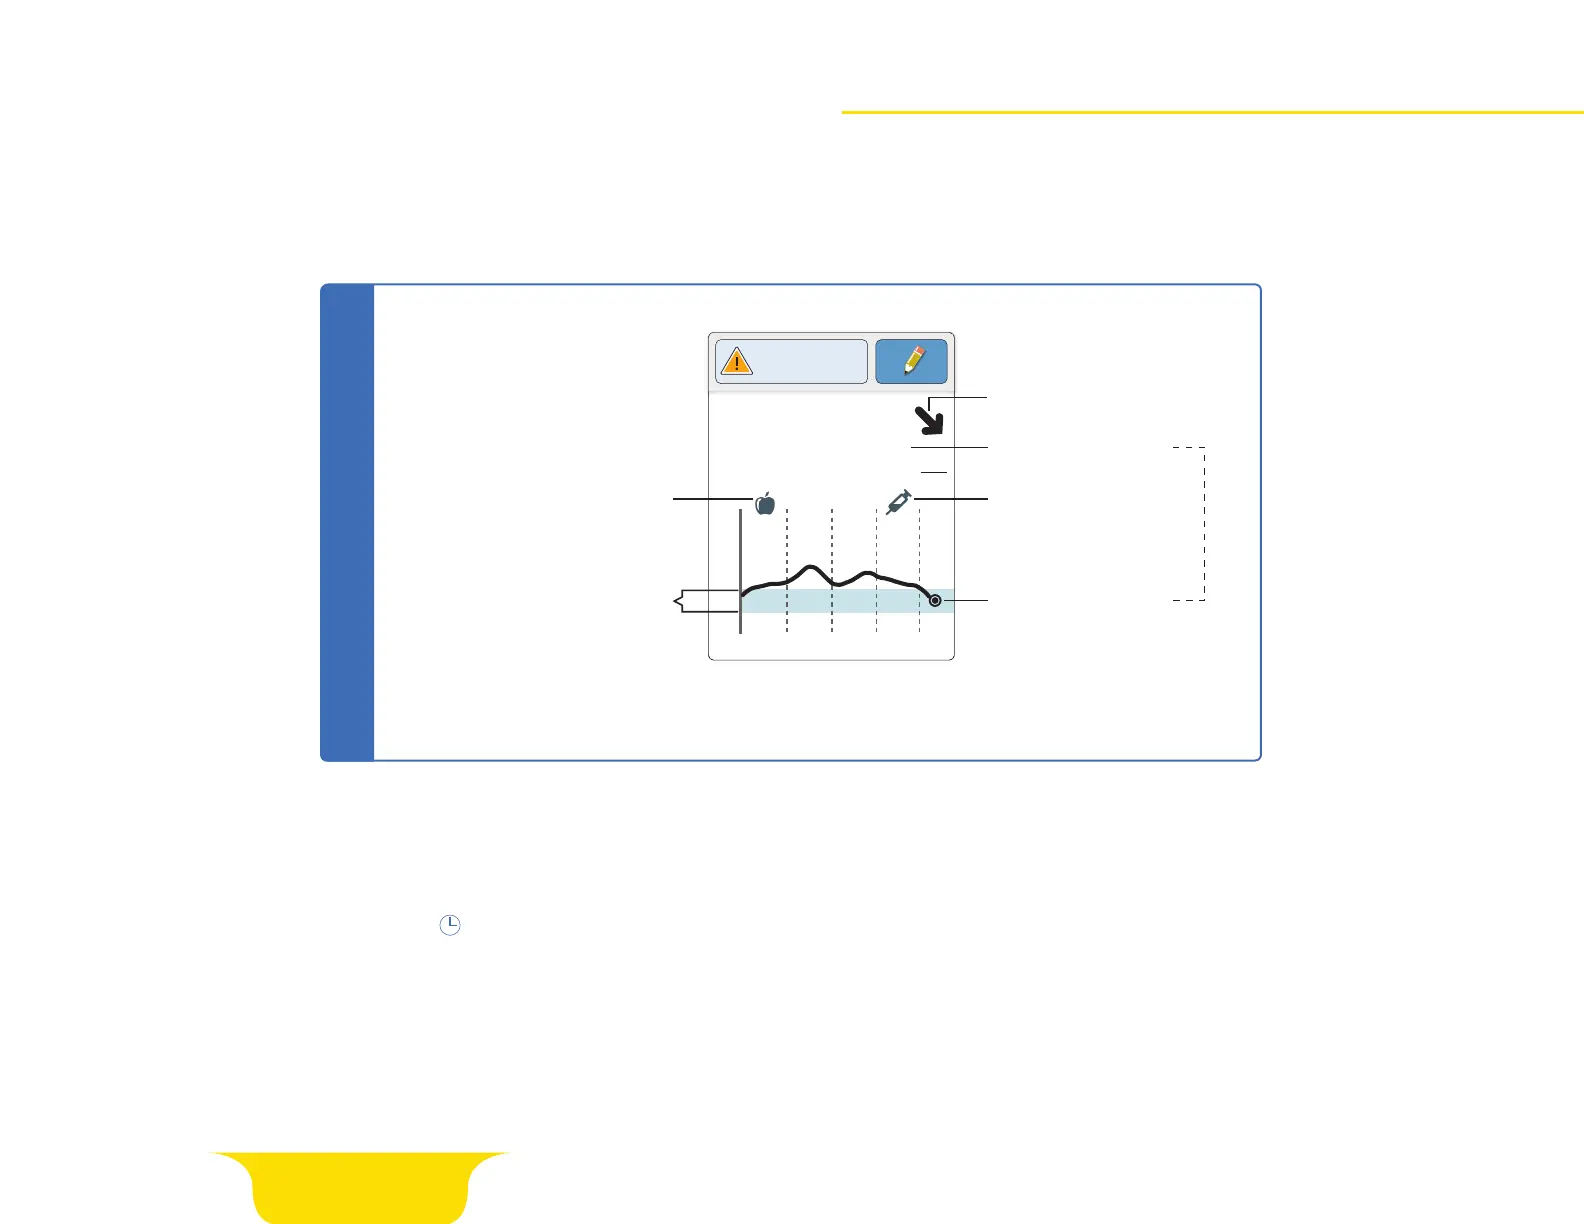
Sensor glucose readings appear after scanning your sensor. Before making treatment decisions, it is important
to understand your sensor readings. Use all of the information on the screen when deciding what to do or
what treatment decision to make.
Page 14 of 25
350
250
150
50
2pm 6pm 10pm
82
mg
dL
Glucose Going
Low
Glucose Trend Arrow
Rapid-Acting
Insulin Note
Food Note
Current Glucose
Current Glucose
Target Glucose Range
Your Target Glucose Range
is not related to your
glucose alarm settings.
Sensor Glucose Readings
NOTE: The symbol may appear, indicating the reader time was changed. Gaps in the graph
may result or glucose readings may be hidden.
NOTE: While sensor glucose readings are gathered in the system range of 40-400 mg/dL, the
graph display range is 0-350 mg/dL for ease of review on screen. Glucose readings above 350
mg/dL are displayed at 350 mg/dL.